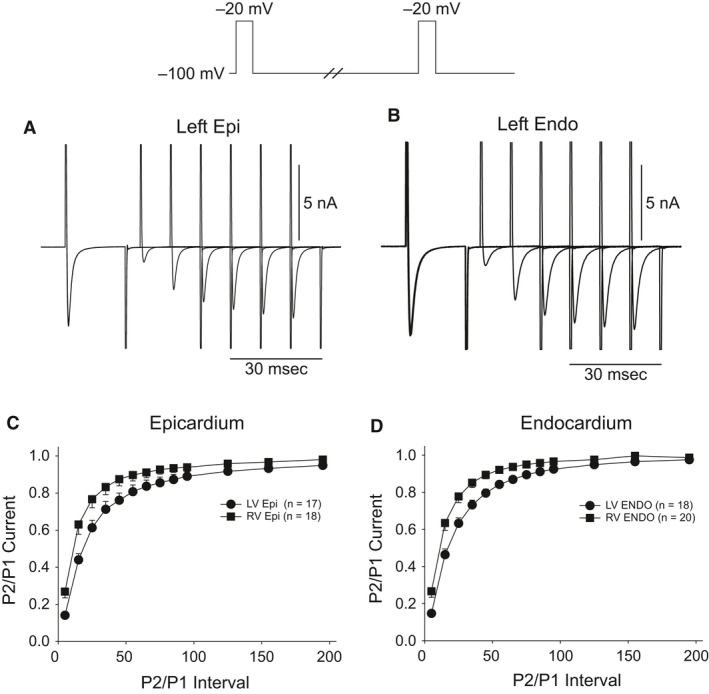
Figure 5.

Representative traces recorded from a LV epi (A) and LV endo myocyte (B) showing recovery from inactivation. Recover was measured using two identical voltage clamp steps to −20 mV from a holding potential of −100 mV separated by varying time intervals. The mean data for recovery from inactivation for epicardium (C) and endocardium (D) are shown.
