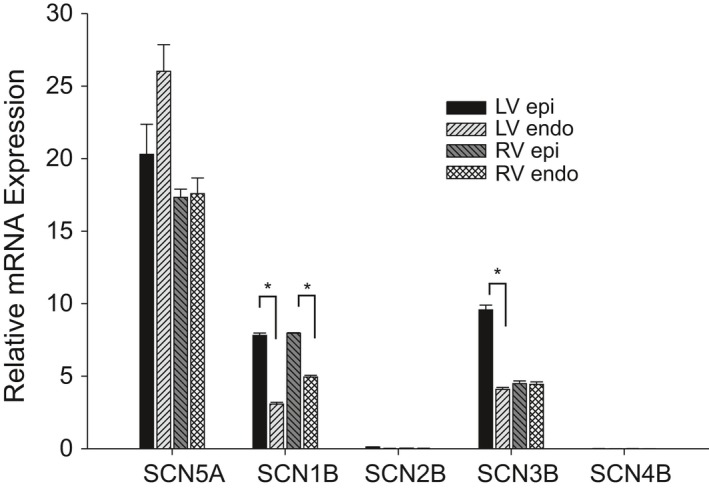
Figure 6.

Bar graph comparing fold changes in left ventricle and right ventricular tissue for mRNA encoding five voltage‐gated sodium channel subunits in the canine heart. Expression was normalized from ∆C t values for each gene against reference gene 18S. * denotes P < 0.05.
