Figure 7.

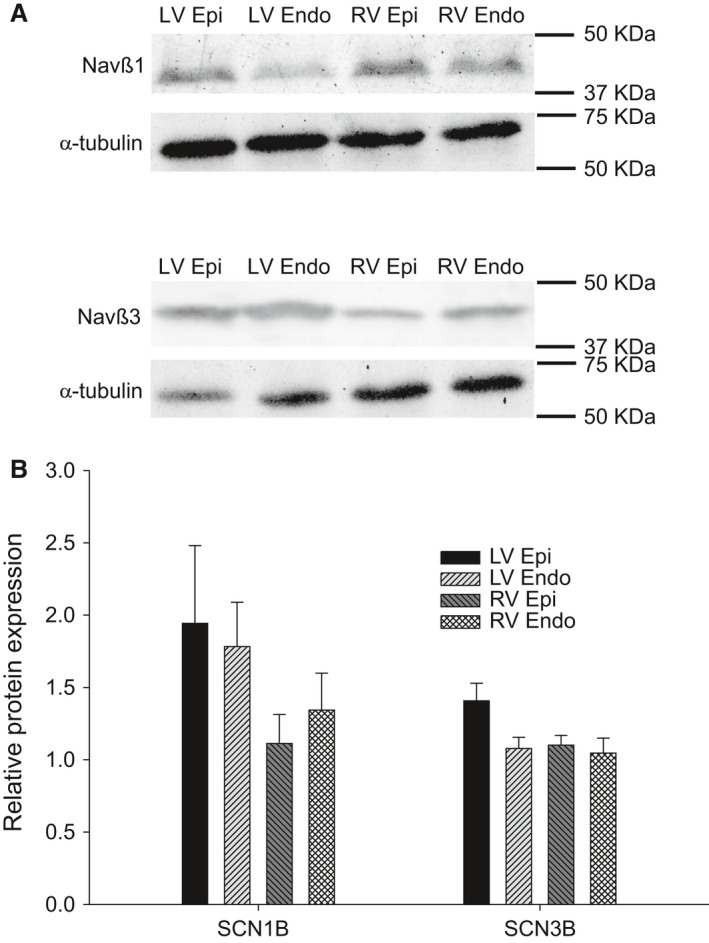
Representative Western blots and relative protein level (to α‐tubulin) of Nav β1 and Nav β3 in RV and LV (A). Mean data showing protein levels of Nav β1 and Nav β3. Tissue obtained from n = 3 animals.

Representative Western blots and relative protein level (to α‐tubulin) of Nav β1 and Nav β3 in RV and LV (A). Mean data showing protein levels of Nav β1 and Nav β3. Tissue obtained from n = 3 animals.