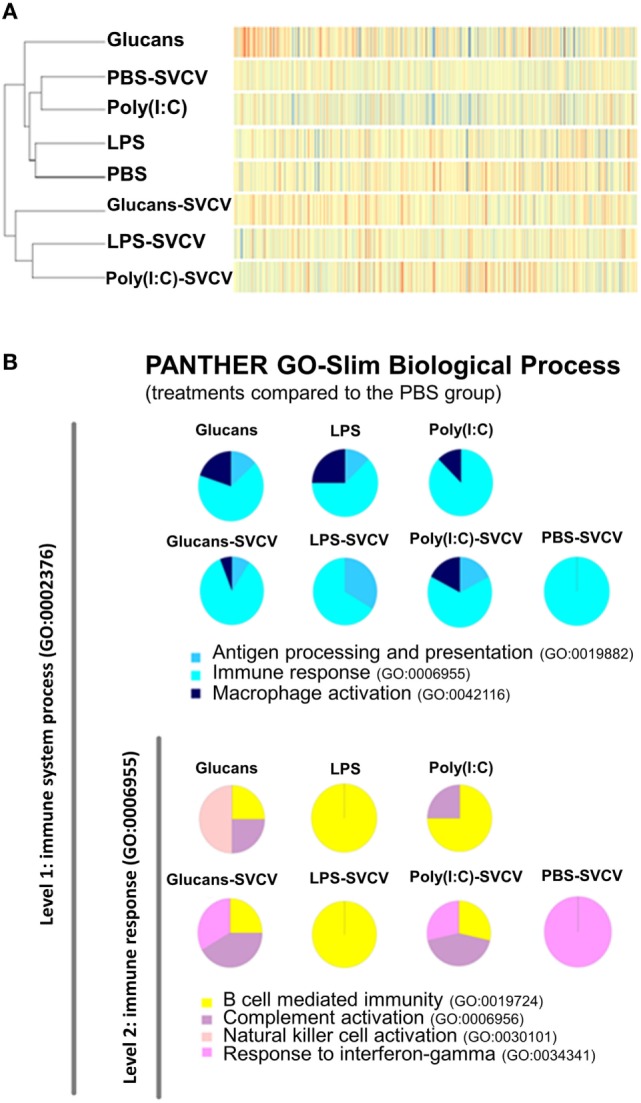
Figure 3.

Similarity analysis of the transcriptome response at 35 days post-immunostimulation in the presence or absence of Spring Viremia Carp Virus (SVCV) infection. (A) Dendrogram and heatmap representing the overall microarray results. The samples were divided into two clusters, one containing the pathogen-associated molecular patterns (PAMP)-stimulated groups and the individuals infected in the absence of pre-stimulation, and the other including the groups that were pre-stimulated with PAMPs and then infected with SVCV. In both clusters, the β-glucans formed a separate branch, indicating that this stimulus induced the most differential response. (B) Functional classification of DEGs in the zebrafish kidney between the different treatments and the phosphate-buffered saline-treated group according to Slim Biological Process Gene Ontology Terms. The level 1 category “Immune System Process” was selected, and within that category, the level 2 category “Immune Response.” After SVCV challenge, the gene categorization was conditioned by previous stimulation with a PAMP.
