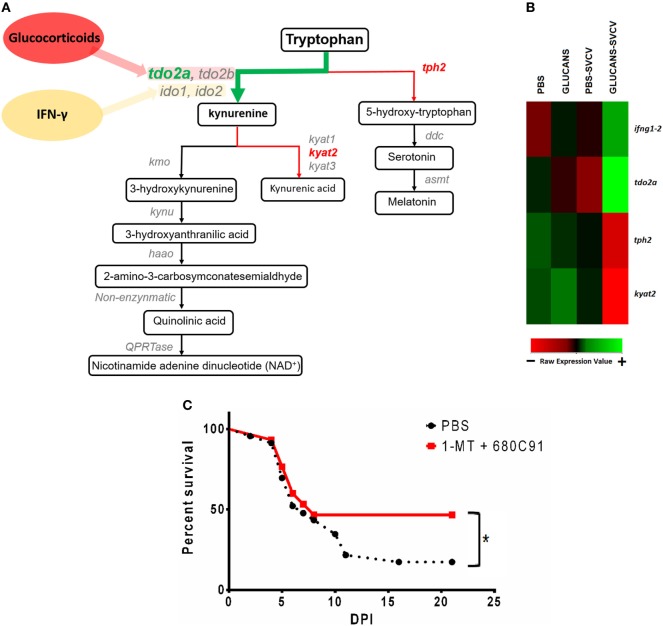
Figure 7.
Analysis of the kynurenine pathway of tryptophan catabolism in zebrafish inoculated with β-glucans. (A) Schematic representation of the kynurenine pathway and the DEGs in the comparison Glucans-Spring Viremia Carp Virus (SVCV) vs. Glucans-PBS (tdo2a, kyat2) and the comparison Glucans-SVCV vs. PBS (tph2). (B) Heatmap representing some of the most affected genes after β-glucan treatment. Whereas ifng1-2 and tdo2a are highly expressed in the Glucans-SVCV group, tph2 and kyat2 have lower expression levels in these fish. A color gradient scheme representing gene modulation (red: lower expression; green: higher expression) is shown on the bottom. (C) Kaplan–Meier survival curves representing the effect of a TDO-inhibitor (C80C91) and an IDO-inhibitor (1-MT) during a challenge with SVCV in adult zebrafish. A significant increase in the survival rate was observed in individuals inoculated with the inhibitors. Significant differences are represented by asterisks (*p < 0.05).

