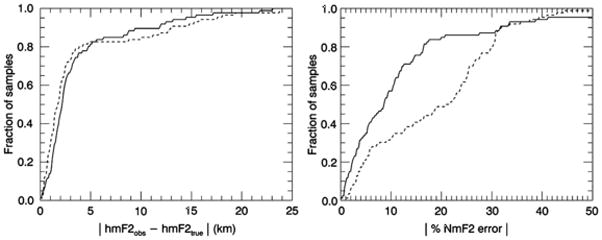
Figure 3.

The left panel shows the fraction of the 86 limb profile samples from one simulated ICON orbit with a retrieved hmf2 value within the range of the known input true value. The dashed line represents the first run with a floating bias, and the solid line represents the second pass with a fixed bias set to the median value of all the biases. The right panel shows the same representation for NmF2 that is more strongly dependent on the absolute intensity of the 83.4 nm emission, and thus the bias in the measurement.
