Abstract
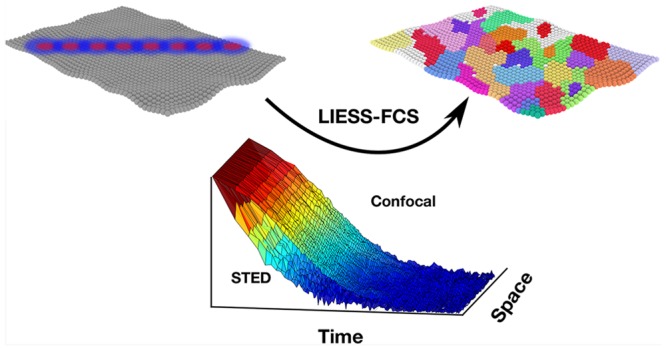
The diffusion dynamics in the cellular plasma membrane provide crucial insights into molecular interactions, organization, and bioactivity. Beam-scanning fluorescence correlation spectroscopy combined with super-resolution stimulated emission depletion nanoscopy (scanning STED–FCS) measures such dynamics with high spatial and temporal resolution. It reveals nanoscale diffusion characteristics by measuring the molecular diffusion in conventional confocal mode and super-resolved STED mode sequentially for each pixel along the scanned line. However, to directly link the spatial and the temporal information, a method that simultaneously measures the diffusion in confocal and STED modes is needed. Here, to overcome this problem, we establish an advanced STED–FCS measurement method, line interleaved excitation scanning STED–FCS (LIESS–FCS), that discloses the molecular diffusion modes at different spatial positions with a single measurement. It relies on fast beam-scanning along a line with alternating laser illumination that yields, for each pixel, the apparent diffusion coefficients for two different observation spot sizes (conventional confocal and super-resolved STED). We demonstrate the potential of the LIESS–FCS approach with simulations and experiments on lipid diffusion in model and live cell plasma membranes. We also apply LIESS–FCS to investigate the spatiotemporal organization of glycosylphosphatidylinositol-anchored proteins in the plasma membrane of live cells, which, interestingly, show multiple diffusion modes at different spatial positions.
Keywords: Diffusion, STED−FCS, scanning FCS, lipids, plasma membrane, simultaneous scanning
Lateral heterogeneity in plasma membrane organization is known to modulate cellular functionalities in a wide range of biological processes.1,2 This heterogeneity and the underlying structures or molecular interaction dynamics can be probed through investigation of molecular diffusion characteristics in the plasma membrane over space and time.3,4 A widely employed approach to exploring molecular diffusion in the plane of the cellular plasma membrane is fluorescence correlation spectroscopy (FCS). FCS is usually employed to determine the average transit times (τD) of molecules through a confocal observation volume to obtain values of the diffusion coefficients (D), revealing changes in molecular diffusion due to, for example, changes in membrane viscosity or molecular interactions.5 Additionally, non-Brownian hindered diffusion caused by molecular interactions and confinements has been studied using FCS.6 In particular, molecular diffusion modes (not only the overall velocity of the molecules but also the diffusion characteristics) in the plasma membrane were measured by recording FCS data for observation spots of varying sizes, ranging from diameters of d ≈ 200 nm to >1 μm.7 By plotting the dependence of τD on d (τD(d)), such spot-variation FCS (svFCS) measurements were used to distinguish between different molecular diffusion modes such as free (Brownian) diffusion, transient trapping in slow moving or immobilized entities (trapped diffusion), or compartmentalized (hop) diffusion.8 Unfortunately, parameters such as trapping times or sizes of the trapping sites could only be extrapolated9 (even in the case of more-advanced camera-based approaches)10,11 because the relevant molecular scales are below the diffraction-limited spatial resolution of these techniques. A remedy to this limitation is the recording of FCS data with subdiffraction-sized observation spots, as created by near-field illumination (necessitating the close proximity to nanostructured surfaces or apertures)12,13 or super-resolution far-field STED microscopy,14,15 giving direct access to the τD(d) dependency at the relevant scales (e.g., ranging from diffraction-limited d ≈ 240 nm down to d < 50 nm). To thoroughly understand the spatial heterogeneity and related spatial diffusion modes, FCS data need to be recorded simultaneously at various points, as achieved by scanning FCS, in which the acquisition is performed simultaneously for each pixel along a quickly scanned line.16−19 Consequently, scanning STED–FCS (sSTED–FCS) recordings for fluorescent lipid analogues in the plasma membrane of living cells revealed distinct transient sites of slowed-down diffusion that extended over <80 nm.18 Unfortunately, it has not been managed to accurately characterize diffusion modes in these transient sites using sSTED–FCS so far because values of τD could only be determined for one observation spot diameter d at a time. The only way to overcome this is the simultaneous recording of confocal and STED–FCS data, as done before in single-point FCS experiments (which lacks the spatial information).20,21
Here, we show an approach allowing (quasi-)simultaneous extraction of spatially resolved STED–FCS data for different values of d. We present line interleaved excitation scanning STED–FCS (LIESS–FCS), which, by fast beam scanning along a line with alternating laser illumination, provides, for each pixel, apparent diffusion coefficients for two different observation spot sizes, one corresponding to the diffraction-limited confocal and the other to super-resolved STED microscopy recordings. We validated our LIESS–FCS approach with simulations and employed it to investigate nanoscale molecular diffusion modes in the plasma membrane of live cells. We observed various diffusion modes for different lipid species and interestingly, a combination of different diffusion characteristics for glycosylphosphatidylinositol (GPI)-anchored proteins.
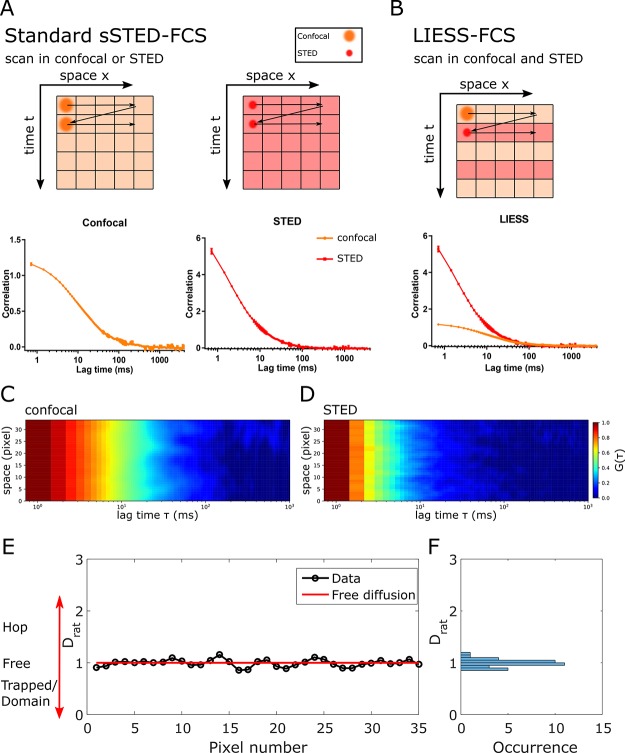
The basic principles of sSTED–FCS and LIESS–FCS are depicted in Figure 1A,B. In sSTED–FCS, either the larger confocal (dconf ≈ 240 nm) or smaller STED (dSTED ≪ 200 nm) observation spot is quickly and multiple times scanned over the sample along a line (or a circle), creating intensity data over time for each pixel on the line. The subsequent calculation of the temporal correlation function for each pixel generates the so-called correlation carpets (in either confocal or STED; Figure 1C,D), and the fitting of each correlation curve reveals values of τD and of the apparent diffusion coefficient Dconf = D(dconf) and DSTED = D(dSTED) for confocal and STED recordings, respectively. In sSTED–FCS, usually, values of Dconf and DSTED can only be determined subsequently, not simultaneously. Therefore, Dconf and DSTED cannot be paired to determine spatially resolved D(d) dependencies because diffusion characteristics may have changed at the individual pixels in between confocal and STED recordings (e.g., due to cell movements, variations in the plasma membrane topology, or any other transient heterogeneity in plasma membrane). In contrast, in LIESS–FCS, the confocal and STED-based observation spots are scanned in an alternating manner (on a line-by-line basis), creating intensity and correlation carpets for confocal and STED modes and, thus, values of Dconf and DSTED for each pixel quasi-simultaneously. This now enables the direct disclosure of diffusion modes for each pixel by calculation of the ratio Drat = DSTED/Dconf for each pixel. Values of Drat give unique information on the diffusion characteristics because they vary for different diffusion modes as detailed before:22,23Drat = 1 for free, Drat < 1 for trapping, and Drat > 1 for hop (or compartmentalized) diffusion.
Figure 1.
Principle of LIESS–FCS: (A) sSTED–FCS data are usually generated from rapidly scanning with a diffraction-limited confocal (orange) or super-resolved STED (red) spot several times (time t axis) along a line (spatial x axis), yielding intensity traces for each pixel along the line that are then correlated to generate the final FCS data (correlation data G(τ) against correlation lag time τ) in confocal and STED separately (bottom plots). (B) In LIESS–FCS, confocal and super-resolved STED–FCS data are generated simultaneously by alternating confocal and STED modes in-between subsequent lines. Arrows: movement of the beam scanner. (C, D) Representative correlation carpets in (C) confocal and (D) STED for simulated data of free diffusion (measurement time of 40 s; dSTED = 100 nm and dconfocal = 240 nm; x axis: correlation lag time τ; y axis: line pixels, i.e., space; color code: normalized G(τ) decaying from red to blue). (E) Values of Drat = DSTED/Dconf over space (pixel number) and (F) corresponding frequency histogram as obtained from the analysis of the correlation carpets of panels C and D, indicating fluctuation around Drat = 1, i.e., free diffusion (red line in panel E).
We first set out to validate LIESS–FCS using Monte Carlo simulation of freely diffusing molecules in a 2D plane. Figure 1E depicts resulting representative values of Drat for each pixel along the line, which, as expected for the simulated free diffusion, fluctuates around 1.0 without spatial heterogeneity and can also be displayed as a Drat histogram for clarity (Figure 1F). It is expected that the accuracy of the acquired Drat values would be highly dependent on the signal-to-noise-ratio (SNR) of the measurement (a general rule for scanning-FCS measurements).24 Note that the SNR is more impaired in the LIESS–FCS modality using alternating lasers, particularly because the total signal is split into two channels (the confocal and STED), i.e., it is halved compared with conventional sSTED–FCS recordings. As expected, the variability in Drat values reduces (i.e., the accuracy increases) with increasing acquisition time and, thus, increasing amount of total signal (from 5 to 40 s; Figure S1).
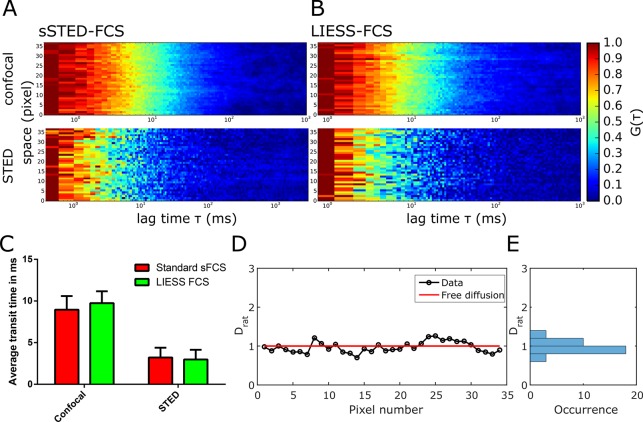
Next, we tested LIESS–FCS experimentally and compared its performance with standard sSTED–FCS. We first used a fluorescent lipid analogue [Abberior Star Red labeled 1,2-dipalmitoyl-sn-glycero-3-phosphoethanolamine (DPPE)] freely diffusing in a fluid supported lipid bilayer [SLB, composed of 50% 1,2-dioleoyl-sn-glycero-3-phosphocholine (DOPC) and 50% cholesterol]. Figure 2A,B show the obtained correlation carpets in STED (dSTED = 100 nm) and confocal (dconf = 240 nm) modes, which appear very similar for conventional sSTED–FCS and LIESS–FCS, respectively. The average transit times τD obtained from fitting all correlation data of the carpets were also similar for both approaches (Figure 2C). Values of Drat as determined from LIESS–FCS fluctuate around 1.0 without significant spatial heterogeneity as expected for free diffusion (Figure 2D,E). As anticipated from the simulated data, the accuracy of determining Drat increased with measurement duration (from 10 to 40 s; Figure S2).
Figure 2.
Experimental LIESS–FCS recordings of free diffusion in SLBs (Abberior Star Red labeled DPPE in DOPC/cholesterol). (A, B) Representative correlation carpets of confocal (dconf = 240 nm, upper panel) and STED (dSTED = 100 nm, lower panel) from (A) conventional sSTED–FCS and (B) LIESS–FCS recordings (measurement time of 150 s and 1.36 μm scan). (C) Values of transit times (average and standard deviation of the mean as error bars) determined from confocal and STED correlation carpets of the sSTED–FCS (red) and LIESS–FCS (green) recordings (72 curves in confocal and STED), indicating no significant difference between sSTED– and LIESS–FCS. (D) Values of Drat along the pixels of the scanned line resulting from the analysis of the LIESS–FCS correlation carpets and (E) frequency histogram indicating fluctuations around Drat = 1.0, i.e., free diffusion (red line in panel D).
In the cellular plasma membrane, lipids have been shown to exhibit diffusion characteristics that are tightly linked to their structure and function.3,7,8,14,22 Therefore, we next used LIESS–FCS to further investigate the diffusional characteristics of fluorescently labeled DPPE (Atto647N-labeled DPPE) and compare it to sphingomyelin (Atto647N-labeled SM) in the plasma membrane of live PtK2 cells. Previous sSTED–FCS experiments have demonstrated mainly free homogeneous diffusion for DPPE and spatially distinct spots of slowed down diffusion in the case of SM, only visible in the STED recordings.18 However, due to the lack of simultaneous information from confocal recordings (e.g., slow diffusion at the same locations), this observation using sSTED–FCS could not directly be attributed to trapping interactions as reported from single-point STED–FCS measurements.14,22,23Figure 3 shows representative LIESS–FCS data [correlation carpets in STED (dSTED = 100 nm) and confocal (dconf = 240 nm) modes as well as values of Drat over space] for DPPE (Figure 3A–C) and SM (Figure 3D–F). For sSTED–FCS data, the correlation carpets of the STED recordings demonstrate the appearance of spots of slowed down diffusion in the case of SM, unlike DPPE (Figure 3A,D). The LIESS–FCS modality now allows us to directly link these spots to trapped diffusion because Drat is ≪1.0 at these spatial positions only (highlighted by the numbers in Figures 3D,E and S3), while Drat is close to 1.0 in between (nearly free diffusion, as continuously detected for DPPE). Therefore, any other spatial heterogeneity showing up, such as that already in the confocal correlation carpets of DPPE (Figure 3A,B; arrows in the correlation carpets and Drat plot), are still characterized by free diffusion, i.e., they do not relate to trapping interactions despite the obvious heterogeneity. A possible cause for such heterogeneity may be the uneven plasma membrane topology involving curvatures.18
Figure 3.
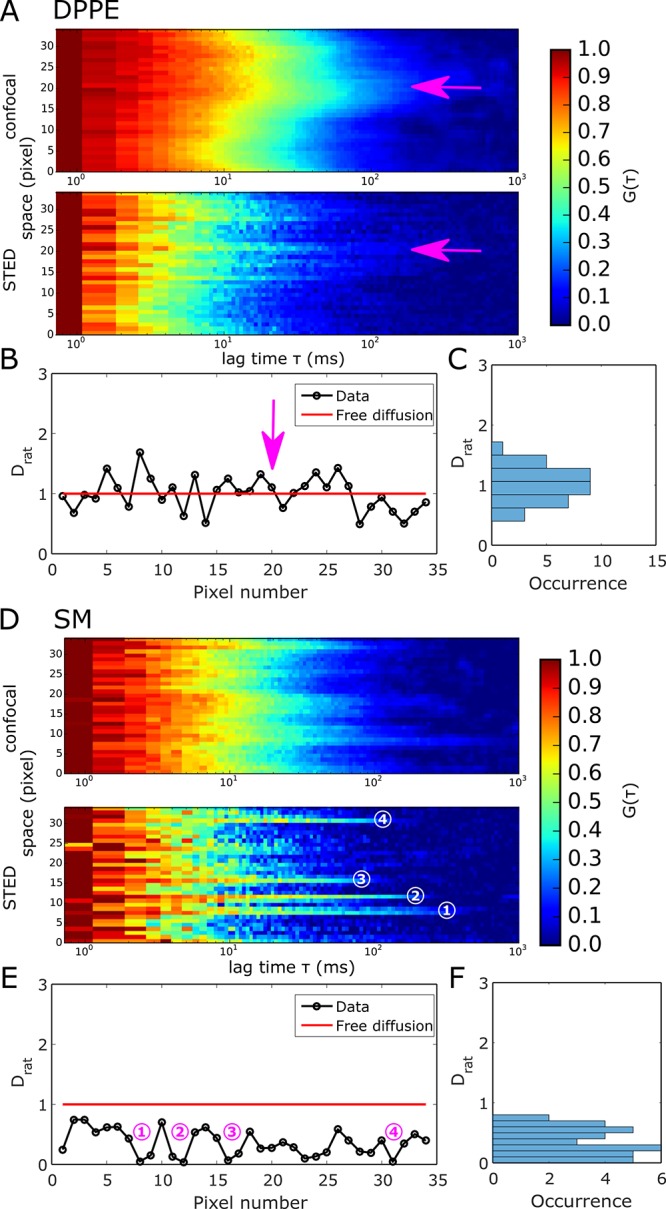
Experimental LIESS–FCS recordings for Atto647N-labeled DPPE (panels A–C) and Atto647N-labeled SM (panels D–F) in the plasma membrane of live PtK2 cells. (A) Representative correlation carpets of simultaneous confocal (dconf = 240 nm, upper panels) and STED (dSTED = 100 nm, lower panels) recordings for DPPE (measurement time of 120 s and 1.36 μm scan). (B) Values of Drat resulting from the correlation carpet analysis and (C) frequency histogram indicating fluctuation around Drat = 1, i.e., free diffusion for DPPE. The arrows indicate an exemplary area where heterogeneity is still characterized as free diffusion. (D) Representative correlation carpets of confocal (dconf = 240 nm, upper panels) and STED (dSTED = 100 nm, lower panels) recordings for SM (measurement time of 45 s and 1.36 μm scan). (E) Values of Drat resulting from the correlation carpet analysis and (F) frequency histogram indicating trapping sites (Drat ≪ 1). Numbers in panels D and E show the exact same trapping sites.
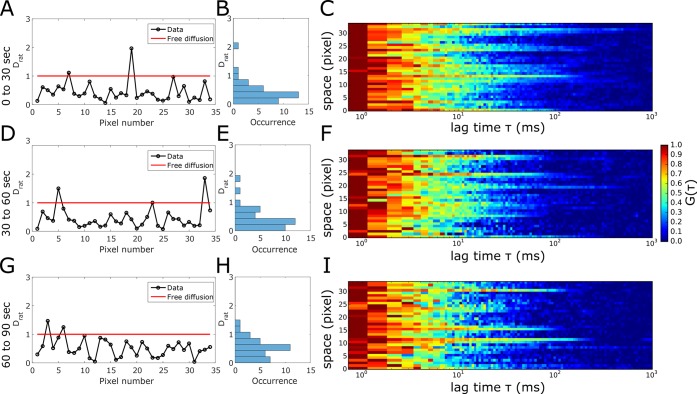
To better understand the temporal organization of the depicted trapping sites for SM, we split the longer LIESS–FCS data into subsequent 30 s measurements. The respective correlation carpets as well as spatially resolved values of Drat reveal a transient character of the sites, i.e., trapping sites disappeared and new ones appeared (Figure 4) (due to either some sort of molecular assembly and disassembly or diffusion), which is in accordance with the transient character of the spots of slowed-down diffusion observed in previous sSTED–FCS recordings.18 Because they still dominate the 30 s recordings, the trapping sites have to be stable for at least a few seconds. This transient character brings up an issue of the duration of a LIESS–FCS measurement because acquisition times that are too long (which are definitely favorable for improved statistical accuracy; compare Figures S1 and S2) may average over the appearance and disappearance of the trapping sites. This is exemplified in Figure S4, which shows the correlation carpet and spatially resolved values of Drat for different acquisition time windows (0–10 s, 0–20 s...0–100 s) of the same LIESS–FCS recording. It becomes obvious that too short acquisition times (10 s) result in noisy data (as highlighted by spikes toward values of Drat ≫ 1.0), while acquisition times that are too long (>40 s) average over appearing and disappearing trapping sites resulting in rather spatially homogeneous values of Drat < 1.0 (because, over time, almost every pixel along the scanned line has experienced a trapping site). Note that the 100 s recording for DPPE still resulted in continuous values of Drat = 1.0, precluding the appearance of dominant trapping sites for this lipid analogue. Finally, relating our current LIESS–FCS data to the previous point and scanning STED–FCS data,14,18,22,23 we can conclude that the trapping sites are smaller than 80 nm in size and transient in the second-time range, and certain lipids such as SM transiently (over a few milliseconds) interact with entities in these hot-spots.
Figure 4.
Transient nature of the trapping hot-spots; temporal cropping of the experimental LIESS–FCS recordings for Atto647N-labeled SM in the plasma membrane of live PtK2 cells. Measurement times as marked: (A–C) 30–60 s, (D–F) 30–60 s, and (G–I) 60–90 s. (A, D, G) Drat values for all of the pixels of the scanned lines, (B, E, H) frequency histograms, and (C, F, I) representative correlation carpets of STED recordings (dSTED = 100 nm) indicating trapping sites (Drat ≪ 1) and fluctuations in between the subsequent recordings.
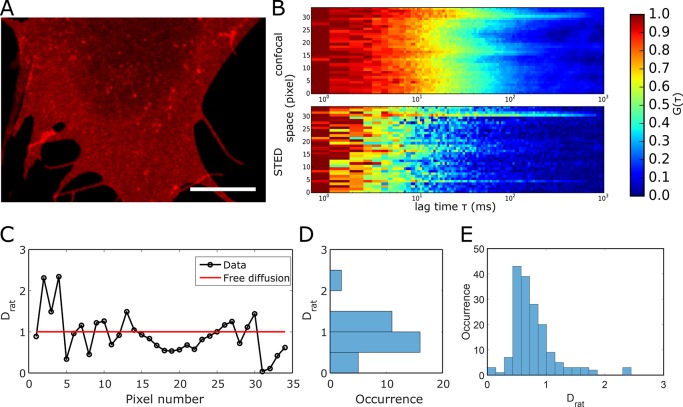
Finally, we employed LIESS–FCS to investigate the diffusional behavior of GPI-anchored proteins (GPI-APs) that play a major role in various cellular signaling pathways. Their spatiotemporal organization is quite controversial25−27 and can now be tackled with our technique. Figure 5 depicts representative LIESS–FCS data for a GPI-AP in the cellular plasma membrane of live PtK2 cells. We utilized a GPI-anchored SNAP tag (GPI-SNAP) as a representative GPI-AP.23Figure 5A shows a confocal image of the basal plasma membrane of a live PtK2 cell transfected with GPI-SNAP (labeled with the dye Abberior STAR Red), indicating an almost-homogeneous distribution with only a few bright spots. Such bright spots were observed before for such GPI-APs,23 and they were associated with immobile GPI clusters or assemblies at the close vicinity of the plasma membrane. Crossing of these isolated bright GPI-AP clusters during beam scanning should in principle be avoided in scanning-FCS measurements because such immobile features usually introduce a bias to the data due to photobleaching, appearing as correlation curves with prolonged decay times.24 Such long decays also appear in some locations of the representative correlation carpet shown in Figure 5B. However, as the photobleaching-based bias affects both the confocal and the STED correlation carpets at the same position, these events can be assigned in a straightforward manner to a photobleaching artifact (while they may accidentally be considered as trapping sites in standard sSTED–FCS recordings; see Figure S5A). Concerning the mobile pool, the diffusion modes of GPI-SNAP turned out to be quite heterogeneous. As shown in the representative data of Figures 5C,D and S5B, we observed values of Drat ranging from ≪1 (trapping) over 1 (free) to >1 (hop). This is confirmed by the broad histogram of Drat values gathered from LIESS–FCS measurements on 5 different cells, tailing into values of Drat > 1 (Figure 5E), and its peak value of Drat = 0.6 highlights a dominant trapping diffusion character. We have to note that this heterogeneity came apparent despite a rather long measurement time of 70 s, which excludes the possibility of noise-related heterogeneity.
Figure 5.
Experimental LIESS–FCS recordings of the fluorescently tagged (Abberior STAR Red) GPI-SNAP protein in the plasma membrane of live PtK2 cells. (A) Representative confocal image of a portion of the cellular membrane indicating homogeneous distribution with rare bright and immobile clusters. Scale bar: 10 μm. (B) Representative correlation carpet of the simultaneous confocal (dconf = 240 nm) and STED recordings (dSTED = 100 nm, measurement time of 70 s and 1.36 μm scan). (C) Values of Drat resulting from the analysis of the correlation carpet with (D) frequency histogram indicating large fluctuation of Drat. (E) Histogram of values of Drat obtained from 5 different line scans on 5 different cells with a peak at Drat = 0.6 and a broad distribution with values ranging from Drat ≪1 (trapping) and Drat = 0 (free) to Drat > 1 (hop), confirming the strong variation in diffusion modes.
Overall, our data demonstrate the capability of LIESS–FCS to directly observe spatial heterogeneity in molecular diffusion behavior (such as spatially distinct sites of trapping, hop, or free diffusion). The strength of LIESS–FCS results from the simultaneous acquisition of confocal and STED–FCS data at different spatial positions. Unfortunately, this comes with the price of a lower SNR, which demands rather moderate acquisition times of 30–100 s and moderately reduced observation spots d ≈ 100 nm. A remedy may be the use of dyes with even-further-increased fluorescence yield, the use of time-gated detection schemes,20 or phasor-plot analysis.28 Moreover, the sensitivity of LIESS–FCS may further be improved by the combination with other advanced spatiotemporal correlation techniques such as pair correlation function (pCF)29,30 and iMSD analysis.11,31 Here, the very same data set may be used to reveal potential obstacles (diffusion barriers via pCF) and very faint (small, transient, or both) sites of hindrances (via iMSD), both of which may be linked to the spatially resolved diffusion modes obtained form LIESS–FCS.32 Furthermore, different length scales, which are necessary to calculate the D(d) dependency, may also be assessed by binning adjacent pixels from a single sSTED–FCS measurement (similar to the binning approach for obtaining D(d) dependencies in camera-based FCS experiments).10,33 This would improve the temporal resolution of the sFCS measurements by a factor of 2 because the confocal line scan becomes obsolete. Unfortunately, binning can only be performed along the direction of scanning resulting in skewed and elongated observation spots and, thus, less-accurate results than those obtained from the LIESS–FCS approach (Figure S6).
LIESS–FCS provides an unique tool for the investigation of the lateral organization of cellular membranes on variable length scales accounting for bias due to biological heterogeneity or photobleaching artifacts and for possibly answering long-standing questions of functional membrane heterogeneity.1,2 Moreover, a combination of LIESS–FCS with other spatiotemporal methodologies will undoubtedly provide invaluable insights into cellular dynamics in the future.
Materials and Methods
SLB Preparation
SLBs were prepared by spin-coating lipid mixtures as described previously for pure DOPC bilayers.23 A solution with a total concentration of 1 mg/mL of 1,2-dioleoyl-sn-glycero-3-phosphocholine (DOPC, Avanti Polar Lipids) and cholesterol (Avanti Polar Lipids) at a molar ratio of 0.5 in chloroform/methanol (1:2) was doped with 1:2000 fluorescent lipid (Abberior STAR Red DPPE, Abberior) and was spin-coated at 3200 rpm onto a clean 25 mm round microscope coverslip. The SLB was formed after hydrating the lipid film with SLB buffer (150 mM Nacl and 10 mM HEPES). The SLB was stable for hours. Prior to coating, the microscope coverslips were cleaned by etching with piranha acid. Fresh coverslips were stored for no longer than 1 week.
PtK2 Cell Handling and Labeling
PtK2 cells were kept in DMEM (Sigma-Aldrich) supplemented with 1 mM l-glutamin (Sigma-Aldrich) and 15% FBS (Sigma-Aldrich). For experiments, cells were seeded onto 25 mm round microscope coverslips kept in 35 mm Petri dishes. After the cells were allowed to grow for 24–48 h and reached a confluency of roughly 75%, cells were ready for experiments. After washing with L15 (Gibco), cells were labeled for 15 min with fluorescently lipid analogues (Atto647N-DPPE and Atto647N-SM, Atto-Tec) at a concentration of 0.4 μg/mL and subsequently washed with L15. Including labeling, the cells were kept for not longer than 1 h at room temperature. Measurements were performed at room temperature to prevent internalization of the lipid analogues. The transfection of PtK2 cells was performed using Lipofectamine 3000 (Life Technology) according to the manufacturer’s protocol. The medium was exchanged 3 h after transfection. GPI-SNAP (a kind gift from the lab of Stefan Hell) was labeled with the nonmembrane-permeable SNAP ligand Abberior STAR Red for 45 min in full medium at 37 °C. The cells were washed two times for 15 min with full medium at 37 °C, and subsequent measurements were performed in L15 for not longer than 1 h at room temperature.
Data Acquisition and Fitting
All scanning STED–FCS and LIESS–FCS data were acquired at a customized Abberior STED/Resolft microscope as previously described.23 The data acquisition was controlled with Abberior’s Imspector software. The scanner was optimized for sFCS. Standard sFCS data were obtained from an x–t scan. Measurement times were between 30 and 180 s. For LIESS–FCS, we made use of the line step function, alternating the excitation between the confocal and STED modes between every other scanned line, and the intensity data for confocal and STED modes were sorted into two independent channels. Typically, sFCS acquisition was performed using an orbital scan with a pixel dwell time of 10 μs and scanning frequencies of about 3 kHz. The pixel size was kept to 40 nm, resulting in an orbit with a diameter of roughly 1.5 μm. Control sFCS measurements were performed with a frequency of roughly 1.5 kHz, a pixel dwell time of 10 μs, and an orbit with a diameter of 3 μm.
Confocal and STED microscopy performances were checked using 20 nm Crimson beads on a daily basis. The diameter dSTED of the observation spots in the STED mode were deduced from measurements of the freely diffusing fluorescent lipid analogue Abberior Star Red DPPE. dSTED was calculated from the diameter of the confocal observation spot dconfocal (as determined from Crimson bead measurements) and the transit times in confocal (τD,confocal) and STED (τD,STED) mode:
We usually employed dSTED ≈ 100 nm in our LIESS–FCS measurements; smaller diameters as realized in previous single-point and scanning STED–FCS experiments resulted in correlation data that were too noisy.
For analysis, the x–t intensity carpets (temporal fluorescence intensity data for each pixel) were correlated and subsequently fitted using the conventional model for 2D diffusion in a plane:
in the FoCuS-scan software24 (https://github.com/dwaithe/FCS_scanning_correlator) with N as the average number of molecules in focus τD as transit time, α as anomaly factor, and Of as offset. To remove immobile components, the first 10 to 20 s were cropped out from all measurements. Additionally, the first pixel of the line was cropped out. In some cases, especially for cell measurements, a photobleaching correction was applied (fitting the total intensity data over time with a monoexponential decay for SM or averaging over 15 s time intervals for DPPE). Subsequently, the data were fitted with the single component diffusion model. The anomaly factor α was fixed to 1 for the simulation and SLB data but was left free-floating between values of 0.8–1.05 for cellular data.14 To obtain stable fits, the data were bootstrapped 20 to 40 times.24 From the obtained transit times in confocal and STED, the apparent diffusion coefficient Dapp was calculated according to:
The values of Drat = Dapp(STED)/Dapp(confocal) over space x were generated using a custom written Matlab script.
The data from binned sSTED–FCS intensity carpets were fitted with a model that allowed for different transit times along a short and a long axis of the observation spot (elliptical model):
During the analysis of the binned FCS data, the transit time along the short axis τx was fixed to the average values obtained from the correlation carpets of the nonbinned case (using the standard isotropic model), and the transit time along the long axis τy was floated.
Simulations of Free Diffusion
To validate our approach, we performed Monte Carlo simulations using the nanosimpy library in Python (https://github.com/dwaithe/nanosimpy) as described previously.24 Freely moving particles were simulated in a box of 2 μm × 8 μm. In the case of a molecule hitting the edges of the box, it was wrapped around to appear on the opposite side. The sFCS line was placed in the center of the box with its ends at least 1 μm away from the boundaries. Molecules were passed through a Gaussian-shaped observation spot as appropriate. To mimic the LIESS–FCS measurements, data were obtained by alternating between confocal and STED observation spots mimicked by a Gaussian with a diameter (full width at half maximum, fwhm) of 240 and 100 nm, respectively. The resulting intensity carpets were saved as. tiff files, correlated, and analyzed as described above for the experimental data.
To test the approach of binning sSTED–FCS data to obtain different length scales, we used the same simulations but sampled with a scanning frequency of 2000 Hz with a fwhm of 80, 160, 240, and 320 nm to mimic actual svFCS and STED–FCS measurements. The 80 nm carpets were then binned using 3, 5, or 7 pixels yielding 160, 240, or 320 nm observation spot sizes along the long axis (dimension “a” in Figure S6a).
Acknowledgments
We thank the Wolfson Imaging Centre Oxford and the Micron Advanced Bioimaging Unit (Wellcome Trust Strategic Award no. 091911) for providing microscope facility and financial support. E.S. is funded by EMBO Long term and Marie Skłodowska-Curie Intra-European (MEMBRANE DYNAMICS) postdoctoral fellowships. We acknowledge funding by the Wolfson Foundation, the Medical Research Council (MRC, grant no. MC_UU_12010 and unit programs G0902418 and MC_UU_12025), MRC/BBSRC/EPSRC (grant no. MR/K01577X/1), the Wellcome Trust (grant no. 104924/14/Z/14), the Deutsche Forschungsgemeinschaft (research unit 1905, “Structure and function of the peroxisomal translocon”), Newton-Katip Celebi Institutional Links grant (no. 352333122), and Oxford internal funds (John Fell Fund and EPA Cephalosporin Fund). J.B.S. acknowledges financial support by the Marie Curie Career Integration Grant “NanodynacTCELLvation”, grant no. PCIG13-GA-2013-618914.
Supporting Information Available
The Supporting Information is available free of charge on the ACS Publications website at DOI: 10.1021/acs.nanolett.8b01190.
Figures showing Monte Carlo simulations, experimental LIESS–FCS and standard sFCS measurements and recordings, and the binning of scanning STED–FCS data. (PDF)
The authors declare no competing financial interest.
Supplementary Material
References
- Lingwood D.; Simons K. Lipid Rafts as a Membrane-Organizing Principle. Science 2010, 327, 46–50. 10.1126/science.1174621. [DOI] [PubMed] [Google Scholar]
- Sezgin E.; Levental I.; Mayor S.; Eggeling C. The Mystery of Membrane Organization: Composition, Regulation and Roles of Lipid Rafts. Nat. Rev. Mol. Cell Biol. 2017, 18, 361–374. 10.1038/nrm.2017.16. [DOI] [PMC free article] [PubMed] [Google Scholar]
- Kusumi A.; Fujiwara T. K.; Chadda R.; Xie M.; Tsunoyama T. A.; Kalay Z.; Kasai R. S.; Suzuki K. G. N. Dynamic Organizing Principles of the Plasma Membrane That Regulate Signal Transduction: Commemorating the Fortieth Anniversary of Singer and Nicolson’s Fluid-Mosaic Model. Annu. Rev. Cell Dev. Biol. 2012, 28, 215–250. 10.1146/annurev-cellbio-100809-151736. [DOI] [PubMed] [Google Scholar]
- Jaqaman K.; Kuwata H.; Touret N.; Collins R.; Trimble W. S.; Danuser G.; Grinstein S. Cytoskeletal Control of CD36 Diffusion Promotes Its Receptor and Signaling Function. Cell 2011, 146, 593–606. 10.1016/j.cell.2011.06.049. [DOI] [PMC free article] [PubMed] [Google Scholar]
- Fahey P.; Koppel D.; Barak L.; Wolf D.; Elson E.; Webb W. Lateral Diffusion in Planar Lipid Bilayers. Science (Washington, DC, U. S.) 1977, 195, 305–306. 10.1126/science.831279. [DOI] [PubMed] [Google Scholar]
- Schwille P.; Korlach J.; Webb W. W. Fluorescence Correlation Spectroscopy with Single-Molecule Sensitivity on Cell and Model Membranes. Cytometry 1999, 36, 176–182. . [DOI] [PubMed] [Google Scholar]
- Wawrezinieck L.; Rigneault H.; Marguet D.; Lenne P.-F. Fluorescence Correlation Spectroscopy Diffusion Laws to Probe the Submicron Cell Membrane Organization. Biophys. J. 2005, 89, 4029–4042. 10.1529/biophysj.105.067959. [DOI] [PMC free article] [PubMed] [Google Scholar]
- Lenne P.-F.; Wawrezinieck L.; Conchonaud F.; Wurtz O.; Boned A.; Guo X.-J.; Rigneault H.; He H.-T.; Marguet D. Dynamic Molecular Confinement in the Plasma Membrane by Microdomains and the Cytoskeleton Meshwork. EMBO J. 2006, 25, 3245–3256. 10.1038/sj.emboj.7601214. [DOI] [PMC free article] [PubMed] [Google Scholar]
- Ruprecht V.; Wieser S.; Marguet D.; Schütz G. J. Spot Variation Fluorescence Correlation Spectroscopy Allows for Superresolution Chronoscopy of Confinement Times in Membranes. Biophys. J. 2011, 100, 2839–2845. 10.1016/j.bpj.2011.04.035. [DOI] [PMC free article] [PubMed] [Google Scholar]
- Bag N.; Sankaran J.; Paul A.; Kraut R. S.; Wohland T. Calibration and Limits of Camera-Based Fluorescence Correlation Spectroscopy: A Supported Lipid Bilayer Study. ChemPhysChem 2012, 13, 2784–2794. 10.1002/cphc.201200032. [DOI] [PubMed] [Google Scholar]
- Di Rienzo C.; Gratton E.; Beltram F.; Cardarelli F. Fast Spatiotemporal Correlation Spectroscopy to Determine Protein Lateral Diffusion Laws in Live Cell Membranes. Proc. Natl. Acad. Sci. U. S. A. 2013, 110, 12307–12312. 10.1073/pnas.1222097110. [DOI] [PMC free article] [PubMed] [Google Scholar]
- Wenger J.; Conchonaud F.; Dintinger J.; Wawrezinieck L.; Ebbesen T. W.; Rigneault H.; Marguet D.; Lenne P.-F. Diffusion Analysis within Single Nanometric Apertures Reveals the Ultrafine Cell Membrane Organization. Biophys. J. 2007, 92, 913–919. 10.1529/biophysj.106.096586. [DOI] [PMC free article] [PubMed] [Google Scholar]
- Manzo C.; van Zanten T. S.; Garcia-Parajo M. F. Nanoscale Fluorescence Correlation Spectroscopy on Intact Living Cell Membranes with NSOM Probes. Biophys. J. 2011, 100, L8–L10. 10.1016/j.bpj.2010.12.3690. [DOI] [PMC free article] [PubMed] [Google Scholar]
- Eggeling C.; Ringemann C.; Medda R.; Schwarzmann G.; Sandhoff K.; Polyakova S.; Belov V. N.; Hein B.; von Middendorff C.; Schönle A.; et al. Direct Observation of the Nanoscale Dynamics of Membrane Lipids in a Living Cell. Nature 2009, 457, 1159–1162. 10.1038/nature07596. [DOI] [PubMed] [Google Scholar]
- Sarangi N. K.; P I. I.; Ayappa K. G.; Visweswariah S. S.; Basu J. K.. Super-Resolution STED-FCS Microscopy Reveals Nanoscale Membrane Reorganization Induced by Pore-Forming Proteins. Langmuir 2016.329649. 10.1021/acs.langmuir.6b01848 [DOI] [PubMed] [Google Scholar]
- Ruan Q.; Cheng M. A.; Levi M.; Gratton E.; Mantulin W. W. Spatial-Temporal Studies of Membrane Dynamics: Scanning Fluorescence Correlation Spectroscopy (SFCS). Biophys. J. 2004, 87, 1260–1267. 10.1529/biophysj.103.036483. [DOI] [PMC free article] [PubMed] [Google Scholar]
- Benda A.; Ma Y.; Gaus K. Self-Calibrated Line-Scan STED-FCS to Quantify Lipid Dynamics in Model and Cell Membranes. Biophys. J. 2015, 108, 596–609. 10.1016/j.bpj.2014.12.007. [DOI] [PMC free article] [PubMed] [Google Scholar]
- Honigmann A.; Mueller V.; Ta H.; Schoenle A.; Sezgin E.; Hell S. W.; Eggeling C. Scanning STED-FCS Reveals Spatiotemporal Heterogeneity of Lipid Interaction in the Plasma Membrane of Living Cells. Nat. Commun. 2014, 5, 5412. 10.1038/ncomms6412. [DOI] [PubMed] [Google Scholar]
- Maraspini R.; Beutel O.; Honigmann A. Circle Scanning STED Fluorescence Correlation Spectroscopy to Quantify Membrane Dynamics and Compartmentalization. Methods 2017, 1. 10.1016/j.ymeth.2017.12.005. [DOI] [PubMed] [Google Scholar]
- Vicidomini G.; Ta H.; Honigmann A.; Mueller V.; Clausen M. P.; Waithe D.; Galiani S.; Sezgin E.; Diaspro A.; Hell S. W.; et al. STED-FLCS – an Advanced Tool to Reveal Spatio-Temporal Heterogeneity of Molecular Membrane Dynamics. Nano Lett. 2015, 15, 5912. 10.1021/acs.nanolett.5b02001. [DOI] [PMC free article] [PubMed] [Google Scholar]
- Koenig M.; Reisch P.; Dowler R.; Kraemer B.; Tannert S.; Patting M.; Clausen M. P.; Galiani S.; Eggeling C.; Koberling F.; et al. Ns-Time Resolution for Multispecies STED-FLIM and Artifact Free STED-FCS; Periasamy A., So P. T. C., König K., Eds.; International Society for Optics and Photonics: Bellingham, WA, 2016; Vol. 9712, p 97120T. [Google Scholar]
- Mueller V.; Ringemann C.; Honigmann A.; Schwarzmann G.; Medda R.; Leutenegger M.; Polyakova S.; Belov V. N. N.; Hell S. W. W.; Eggeling C. STED Nanoscopy Reveals Molecular Details of Cholesterol- and Cytoskeleton-Modulated Lipid Interactions in Living Cells. Biophys. J. 2011, 101, 1651–1660. 10.1016/j.bpj.2011.09.006. [DOI] [PMC free article] [PubMed] [Google Scholar]
- Schneider F.; Waithe D.; Clausen M. P.; Galiani S.; Koller T.; Ozhan G.; Eggeling C.; Sezgin E. Diffusion of Lipids and GPI-Anchored Proteins in Actin-Free Plasma Membrane Vesicles Measured by STED-FCS. Mol. Biol. Cell 2017, 28, 1507–1518. 10.1091/mbc.e16-07-0536. [DOI] [PMC free article] [PubMed] [Google Scholar]
- Waithe D.; Schneider F.; Chojnacki J.; Clausen M. P.; Shrestha D.; Bernardino de la Serna J.; Eggeling C. Optimized Processing and Analysis of Conventional Confocal Microscopy Generated Scanning FCS Data. Methods 2017, 1. 10.1016/j.ymeth.2017.09.010. [DOI] [PMC free article] [PubMed] [Google Scholar]
- Varma R.; Mayor S. GPI-Anchored Proteins Are Organized in Submicron Domains at the Cell Surface. Nature 1998, 394, 798–801. 10.1038/29563. [DOI] [PubMed] [Google Scholar]
- Saha S.; Lee I.-H.; Polley A.; Groves J. T.; Rao M.; Mayor S. Diffusion of GPI-Anchored Proteins Is Influenced by the Activity of Dynamic Cortical Actin. Mol. Biol. Cell 2015, 26, 4033–4045. 10.1091/mbc.e15-06-0397. [DOI] [PMC free article] [PubMed] [Google Scholar]
- Sevcsik E.; Brameshuber M.; Fölser M.; Weghuber J.; Honigmann A.; Schütz G. J. GPI-Anchored Proteins Do Not Reside in Ordered Domains in the Live Cell Plasma Membrane. Nat. Commun. 2015, 6, 6969. 10.1038/ncomms7969. [DOI] [PMC free article] [PubMed] [Google Scholar]
- Lanzanò L.; Coto Hernández I.; Castello M.; Gratton E.; Diaspro A.; Vicidomini G. Encoding and Decoding Spatio-Temporal Information for Super-Resolution Microscopy. Nat. Commun. 2015, 6, 1–9. 10.1038/ncomms7701. [DOI] [PMC free article] [PubMed] [Google Scholar]
- Digman M. A.; Gratton E. Imaging Barriers to Diffusion by Pair Correlation Functions. Biophys. J. 2009, 97, 665–673. 10.1016/j.bpj.2009.04.048. [DOI] [PMC free article] [PubMed] [Google Scholar]
- Bianchini P.; Cardarelli F.; Di Luca M.; Diaspro A.; Bizzarri R.. Nanoscale Protein Diffusion by STED-Based Pair Correlation Analysis. PLoS One 2014, 9.e99619. 10.1371/journal.pone.0099619 [DOI] [PMC free article] [PubMed] [Google Scholar]
- Di Rienzo C.; Cardarelli F.; Di Luca M.; Beltram F.; Gratton E. Diffusion Tensor Analysis by Two-Dimensional Pair Correlation of Fluorescence Fluctuations in Cells. Biophys. J. 2016, 111, 841–851. 10.1016/j.bpj.2016.07.005. [DOI] [PMC free article] [PubMed] [Google Scholar]
- Di Rienzo C.; Gratton E.; Beltram F.; Cardarelli F. Spatiotemporal Fluctuation Analysis: A Powerful Tool for the Future Nanoscopy of Molecular Processes. Biophys. J. 2016, 111, 679–685. 10.1016/j.bpj.2016.07.015. [DOI] [PMC free article] [PubMed] [Google Scholar]
- Jin W.; Simsek M. F.; Pralle A. Quantifying Spatial and Temporal Variations of the Cell Membrane Ultra-Structure by BimFCS. Methods 2018, 1–10. 10.1016/j.ymeth.2018.02.019. [DOI] [PMC free article] [PubMed] [Google Scholar]
Associated Data
This section collects any data citations, data availability statements, or supplementary materials included in this article.


