
Figure 3.
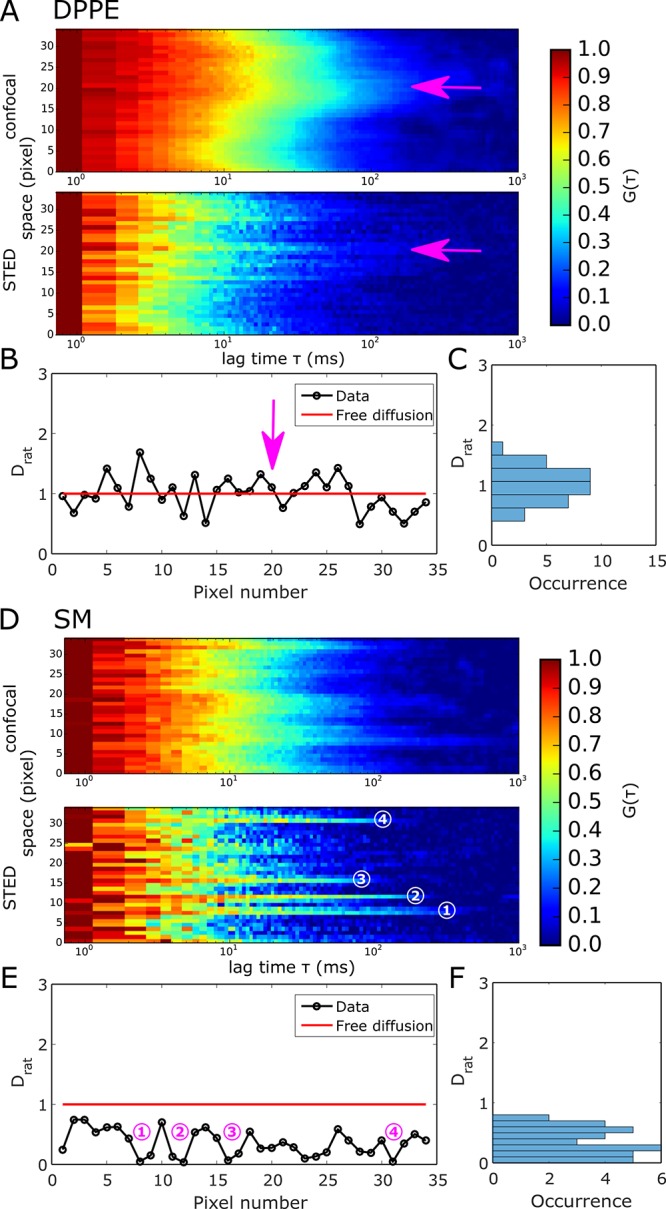
Experimental LIESS–FCS recordings for Atto647N-labeled DPPE (panels A–C) and Atto647N-labeled SM (panels D–F) in the plasma membrane of live PtK2 cells. (A) Representative correlation carpets of simultaneous confocal (dconf = 240 nm, upper panels) and STED (dSTED = 100 nm, lower panels) recordings for DPPE (measurement time of 120 s and 1.36 μm scan). (B) Values of Drat resulting from the correlation carpet analysis and (C) frequency histogram indicating fluctuation around Drat = 1, i.e., free diffusion for DPPE. The arrows indicate an exemplary area where heterogeneity is still characterized as free diffusion. (D) Representative correlation carpets of confocal (dconf = 240 nm, upper panels) and STED (dSTED = 100 nm, lower panels) recordings for SM (measurement time of 45 s and 1.36 μm scan). (E) Values of Drat resulting from the correlation carpet analysis and (F) frequency histogram indicating trapping sites (Drat ≪ 1). Numbers in panels D and E show the exact same trapping sites.