
Figure 1.
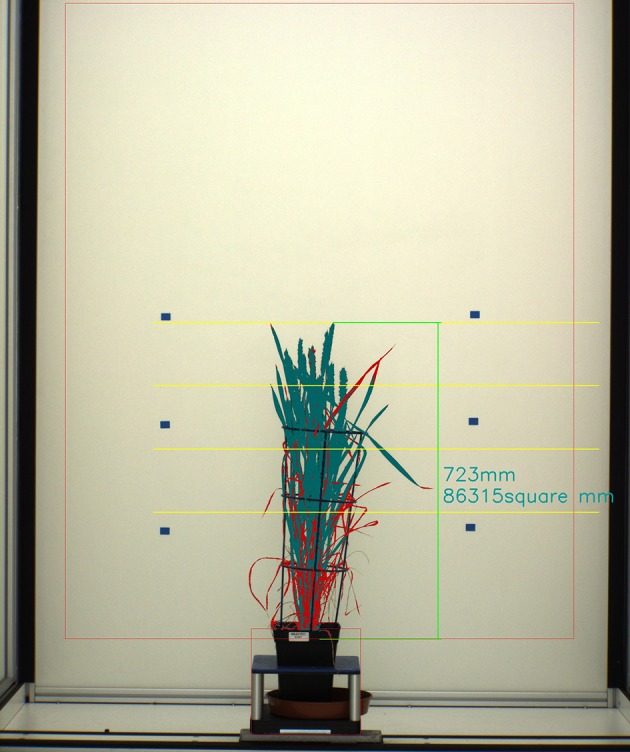
Segmentation of image showing a wheat plant. Plant Area is represented in dark green and red. Plant Senescence is represented by red. Height is represented by vertical green line.
Official websites use .gov
A
.gov website belongs to an official
government organization in the United States.
Secure .gov websites use HTTPS
A lock (
) or https:// means you've safely
connected to the .gov website. Share sensitive
information only on official, secure websites.
Segmentation of image showing a wheat plant. Plant Area is represented in dark green and red. Plant Senescence is represented by red. Height is represented by vertical green line.