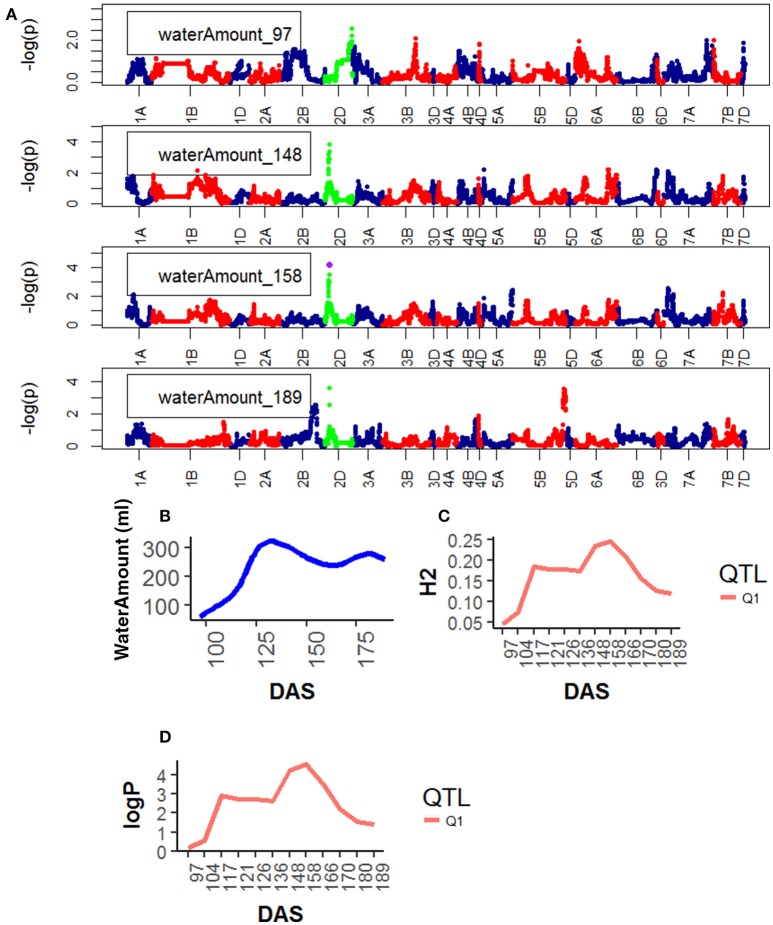
Figure 7.
Time resolved analyses for the trait Water use (Water amount) (A) Manhattan plots highlighting chr4D at four DAS. Purple dots indicate QTLs with P-value < 0.05 and max(–logP) > 4; (B) Population Area mean (C) heritability (H2) showing peak markers (Table 2) per chromosome [P < 0.05, max(–logP)], (D) LOD scores (logP) showing peak markers per chromosome [P < 0.05, max(–logP)].

