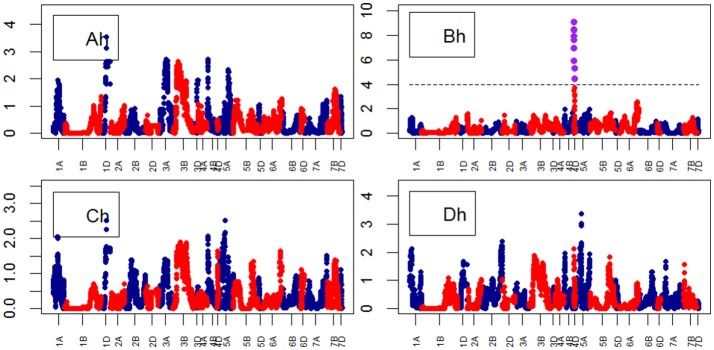
Figure 9.
Manhattan plots from the genetic mapping of the curve's growth parameters corresponding to the trait Height. Purple dots indicate QTLs with P-value < 0.05 and max(–logP) > 4. (Ah–Dh) are the parameters (see Table 1) derived from the 4-Parameter Logistic Model for Height, and are provided in Table 1.

