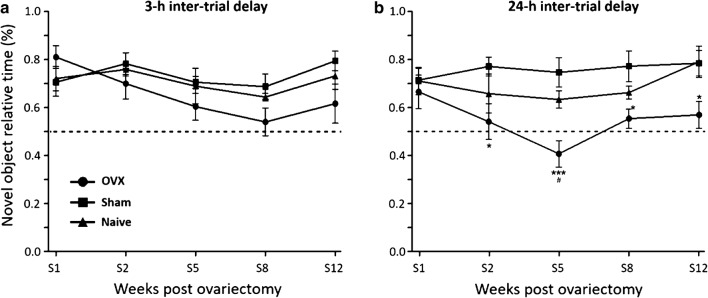
Fig. 2.
Object recognition assessment. Relative exploration time of novel objects (% of total object exploration time) throughout the first 12 weeks following surgery with 3-h inter-trial time (a) or with 24-h inter-trial time (b). Treatment groups: ovariectomized animals receiving vehicle solution (OVX) (N = 10), sham operated animals (N = 10), and naïve animals (N = 8). Dashed line indicates chance performance of task, which is the same amount of time spent exploring the old and novel object. ANOVA followed by Bonferroni test: *P < 0.05 vs. sham group; ***P < 0.001 vs. sham group. Data are mean ± SEM

