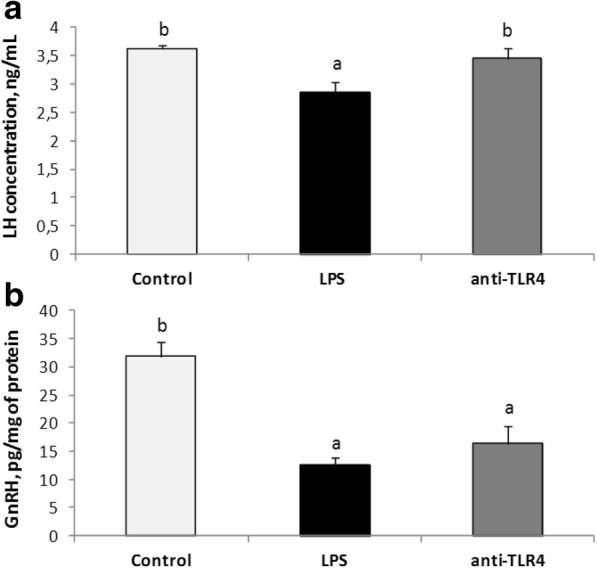
Fig. 1.

Mean (± SEM) concentration of plasma LH (panel A) and GnRH in the ME (panel B) after icv administration of CD14/TLR4 antagonist during central inflammation induced by icv administration of LPS. Different lowercase letters (a, b) indicate significant differences between groups at P < 0.05 (one-way ANOVA followed by Tukey’s post hoc test)
