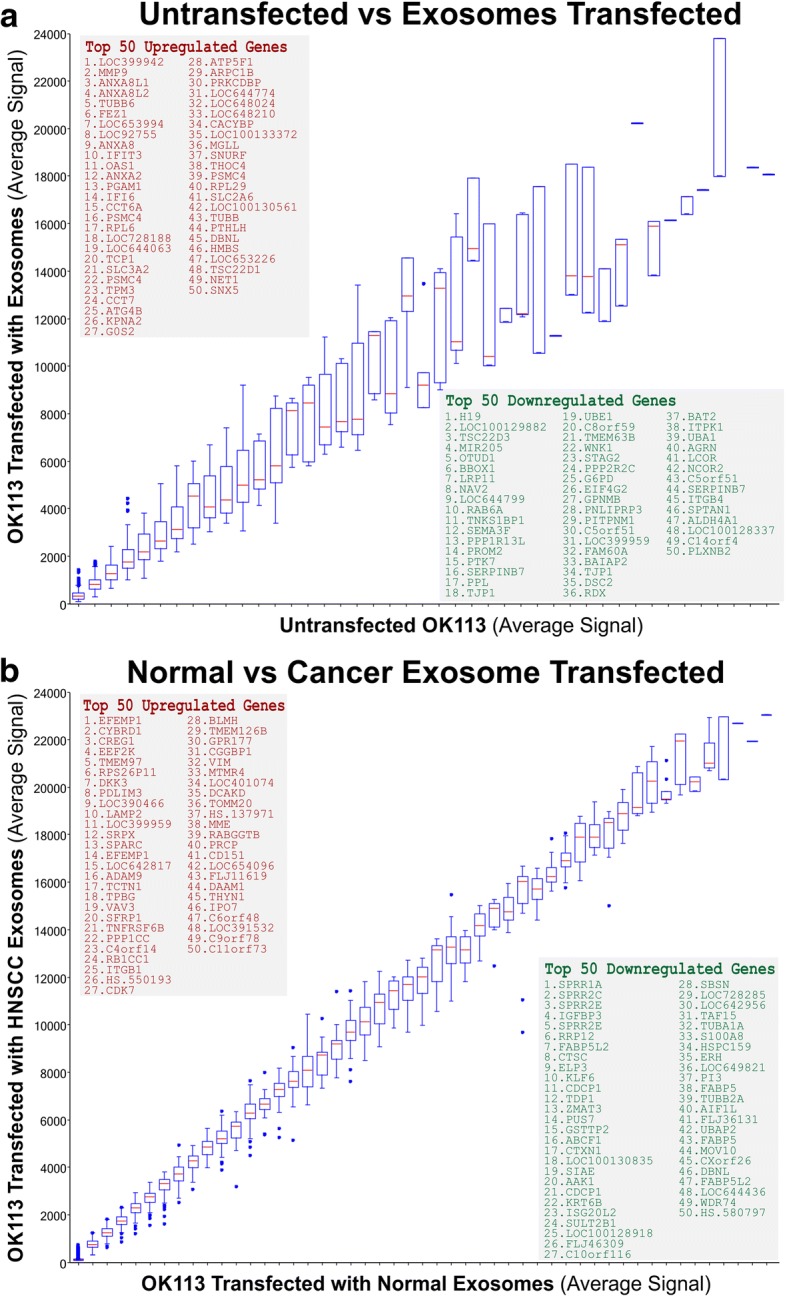
Fig. 5.

Genome-wide differential gene expression analysis on normal primary human oral keratinocytes transfected by normal or cancer-derived exosomes. a Correlation box-whisker plot between untransfected vs exosome (including both normal and cancer exosomes) transfected gene expression profiles. b Correlation box-whisker plot between normal vs cancer exosome transfected gene expression profiles. Insets showing top 50 upregulated and top 50 downregulated genes, respectively
