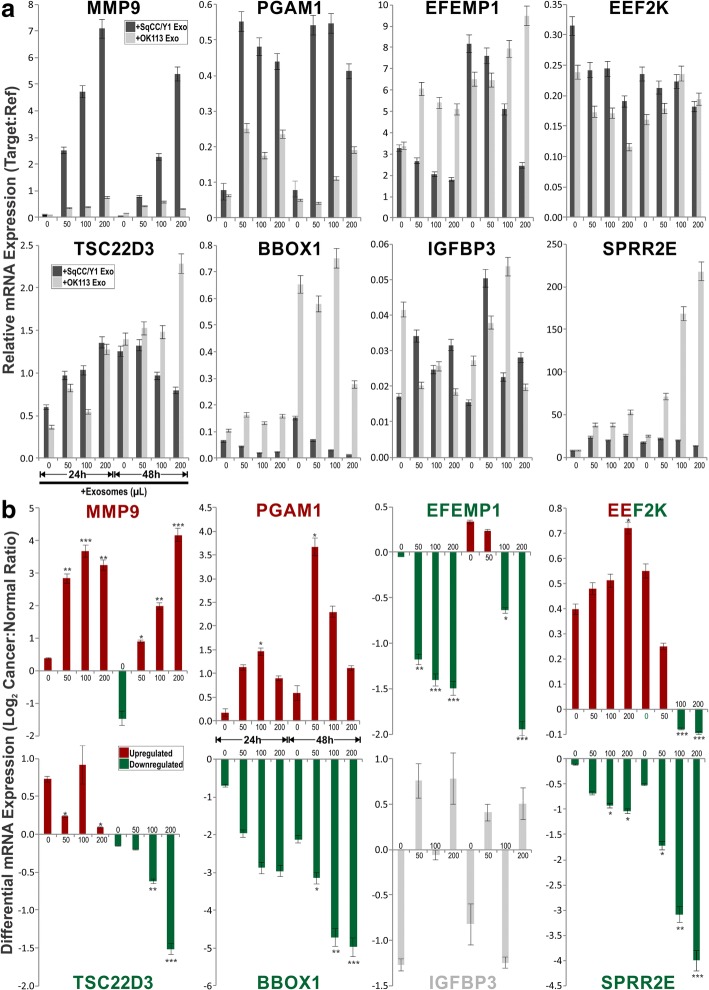
Fig. 7.
Exosome time and dose-response effects on candidate genes (selected from Fig. 6) analysis on primary normal human oral keratinocytes (OK113). OK113 cells were transfected by different doses (0, 50, 100, 200 μL) of exosomes derived from either OK113 or SqCC/Y1 HNSCC cells. Transfected OK113 cells were harvested at two time points (24 h and 48 h) and RT-qPCR were performed to measure each target gene relative expression. a Each bar represents mean ± SEM of relative gene expression (target:reference genes) at each exosome transfection time and dose as indicated. b Each bar, derived from data presented in panel a, represents mean ± SEM of differential gene expression (Log2 Cancer:Normal Ratio) between SqCC/Y1:OK113 exosome transfected OK113 cells at each time and dose of exosomes. Statistical t-test *P < 0.05, **P < 0.01 and ***P < 0.001

