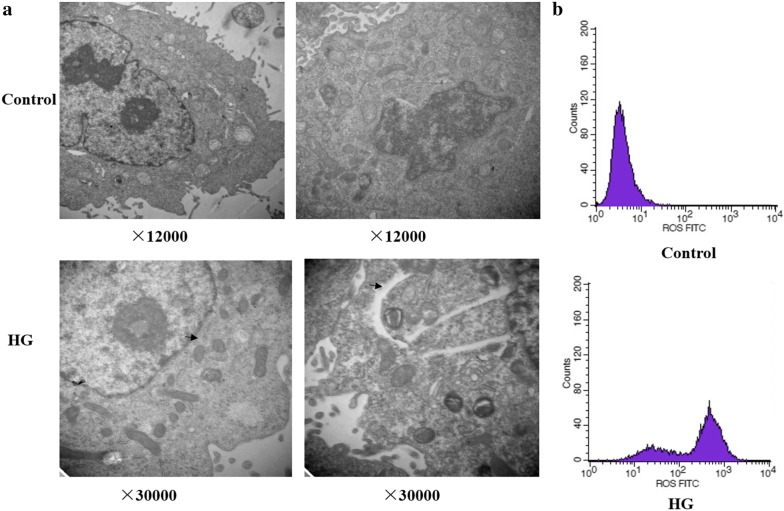
Fig. 2.
Intracellular structure changes and generation of reactive oxygen species induced by high glucose. The transmission electron microscopy (a) and flow cytometry analysis (b) of ARPE-19 cells treated with normal glucose (5.5 mM; Control; ×12,000) or high glucose (30 mM; HG; ×30,000) for 48 h. The autophagosomes in ARPE-19 cells were indicated by arrows

