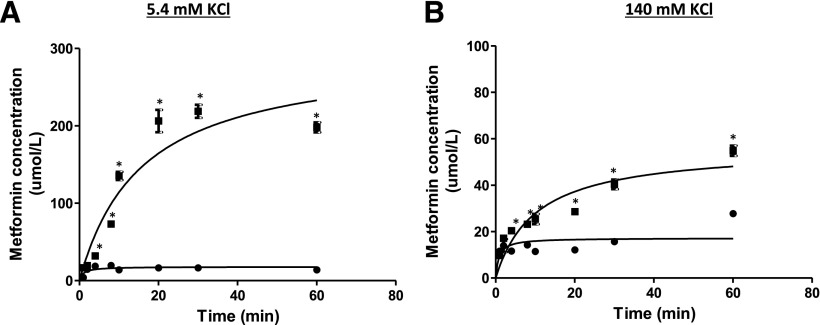
Fig. 5.
Intracellular metformin concentration in human HEK cells in different buffers. Time course of intracellular metformin concentrations in HEK-EV (●) and HEK-OCT1 (▪) in (A) low K+, 5.4 mM KCl buffer, and (B) high K+, 140 mM KCl buffer. The ICS of HEK-EV (1.21 µl/106 cells) and HEK-OCT1 (1.25 µl/106 cells) was used to calculate the metformin unbound intracellular concentrations in two different buffers. Data are presented as mean ± S.E.M. *P < 0.05.

