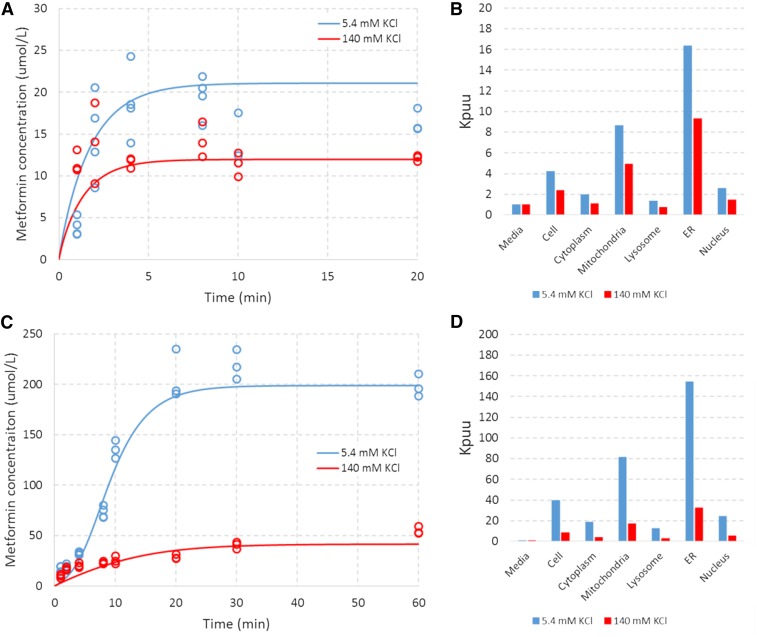
Fig. 6.
Model-based characterization of metformin uptake in HEK-EV and HEK-OCT1 cells under an assumed ER ∆Φ of −80mV. Blue and red symbols represent data of (A) HEK-EV and (C) HEK-OCT1 under extracellular KCl concentrations of 5.4 mM and 140 mM, respectively. Associated lines represent the model-based characterization associated with the derived parameters from Table 1. Blue and red bars represent subcellular accumulation (relative to media concentration) associated with the model-based characterization of uptake in (B) HEK-EV and (D) HEK-OCT1 under extracellular KCl concentrations of 5.4 mM and 140 mM, respectively.

