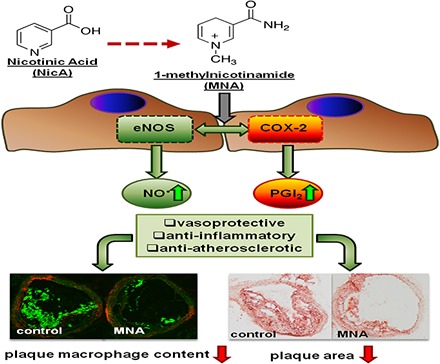
Fig. 8.

Effects of MNA and NicA on the concentration of NicA metabolites in urine and plasma. (A) Results of LC-MS/MS measurement of NicA and NA and MNA plus Met-4Pyr plus Met-2Pyr concentration in urine. Values are means ± S.E.M. (n = 6). *P ≤ 0.05; **P ≤ 0.01 versus untreated control. (B) Diagram showing the NA/MNA ratio in plasma samples based on LC-MS/MS measurement of NA, MNA, Met-2Pyr, and Met-4Pyr in plasma samples taken from untreated control, MNA-, and NicA-treated mice. Values are means ± S.E.M. (n = 6). **P ≤ 0.01 versus MNA-treated group.
