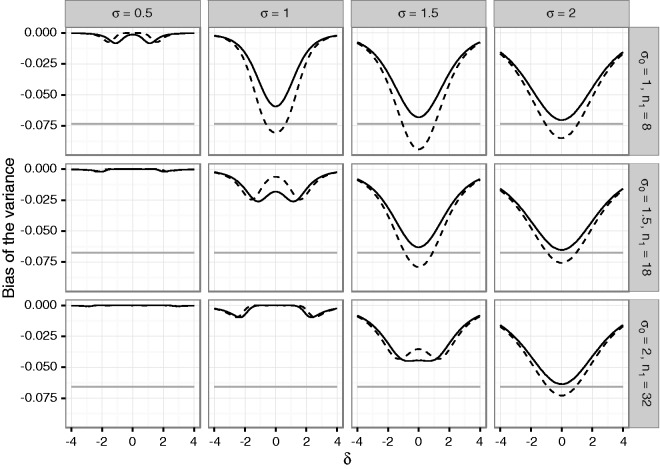
Figure 2.
Bias of the variance under blinded sample size reassessment using the unadjusted (solid line) and adjusted (dashed line) interim variance estimate. The gray line gives the lower bound from Theorem 4 for the bias under sample size reassessment based on the unadjusted variance estimate. The treatment effect used for planning is set to . Rows refer to the a priori assumed standard deviations σ0 determining the first stage sample size n1. The columns correspond to actual standard deviations. The x-axis in each graph denotes the true treatment effect δ, the y-axis shows the bias.

