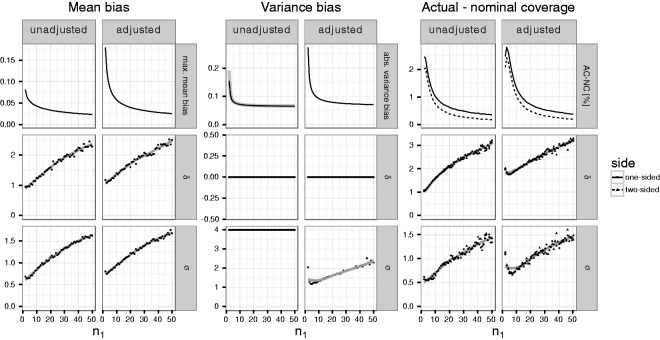
Figure 4.
Maximum absolute mean and variance bias as well as maximum negative difference between actual and nominal coverage probabilities (in percentage points) for given per group first stage sample sizes n1 between 2 and 50; values of δ between 0 and 4; σ between 0.5 and 4. Left columns show the results for the unadjusted sample size reassessment rule, right columns for the adjusted sample size reassessment rule. The first row shows the value for bias and non-coverage, the second shows the effect size δ and the third shows the standard deviation σ at which the specific value is attained. The gray line denotes a Loess smoothed estimate. For the maximum absolute variance bias, based on the unadjusted rule, the theoretical bound is shown using the slightly thicker gray line.

