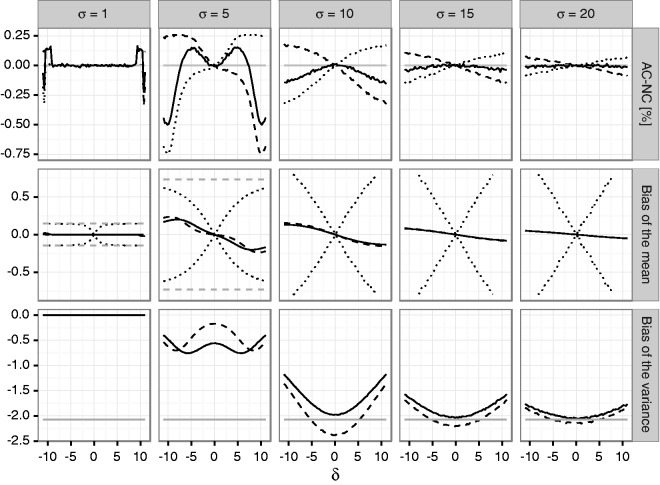
Figure 5.
Coverage probabilities and bias of mean and variance estimates for the case study. The first row of panels shows actual-nominal coverage probabilities (AC-NC) for the 97.5% upper (dashed line), lower (dotted line) and the 95% two-sided confidence intervals, for the unadjusted reassessment rule . The second row shows the bias of the mean estimate if (solid line) or (dashed line) is used. The dotted line shows upper and lower bounds for the bias for general blinded sample size reassessment rules based on . The dashed gray line shows the bounds for the bias for a general unblinded sample size reassessment rule. The third panel shows the bias of the variance estimate if either (solid line) or (dashed line) is used. The red line shows the theoretical boundary for the bias give in Theorem 4.

