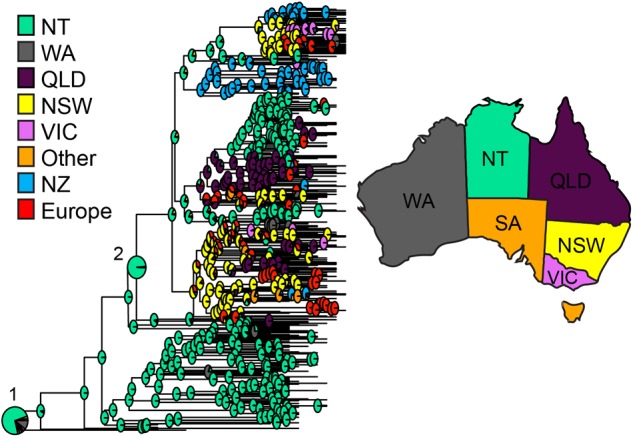
FIGURE 3.

ST93 geographic origins. Ancestral state reconstruction based on maximum clade credibility tree generated using BEAST2 with geographic regions as discrete traits. Each node indicates the log likelihood for specified locations as the origin of the node in pie chart format. Pie charts corresponding with the origins of (1) MSSA and (2) MRSA are enlarged for easier visualization. Abbreviations and colors for regions are as per Figure 2.
