
Extended Data Figure 6. Neurodegenerative process in BRAFVE mice.
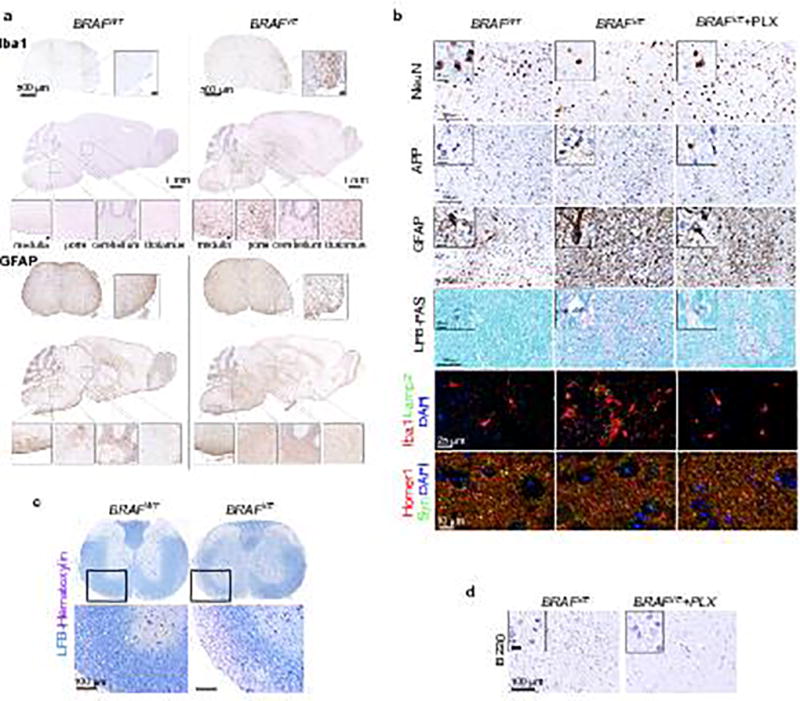
(a) Iba1 and GFAP immunohistochemistry of brain and spinal cord from 6-month-old BRAFVE and BRAFWT. Anatomical regions of insets are indicated. Representative for n=5 BRAFWT and n=4 BRAFVE. Scale bars=500µm for spinal cords and 1mm for brains (50µm for insets). (b) Immunohistochemistry and immunofluorescence as used for quantification in Figure 2h of brain stem for NeuN (neurons), APP (amyloid precursor protein) and GFAP (astrocytes), Iba1+/Lamp2+ cells (phagocytosis), Synaptophysin (Syn) and Homer1 (synapse density) and staining with Luxol-fast-blue (LFB)-PAS. Scale bars=100µm (10µm for insets). Iba1/Lamp2 scale bar=25µm, Syn/Homer1 scale bar=10µm. Representative for 6–9 month old BRAFWT (n=5), BRAFVE (n=4), and for BRAFVE on PLX diet (n=4–6). (c) LFB staining of spinal cord samples from (a). Scale bar=100µm. (d) Immunohistochemistry of brain stem for B220 (B-cells) from BRAFVE on control and PLX diet. Representative for n=4 per genotype. Scale bars=10 µm (10µm for insets).