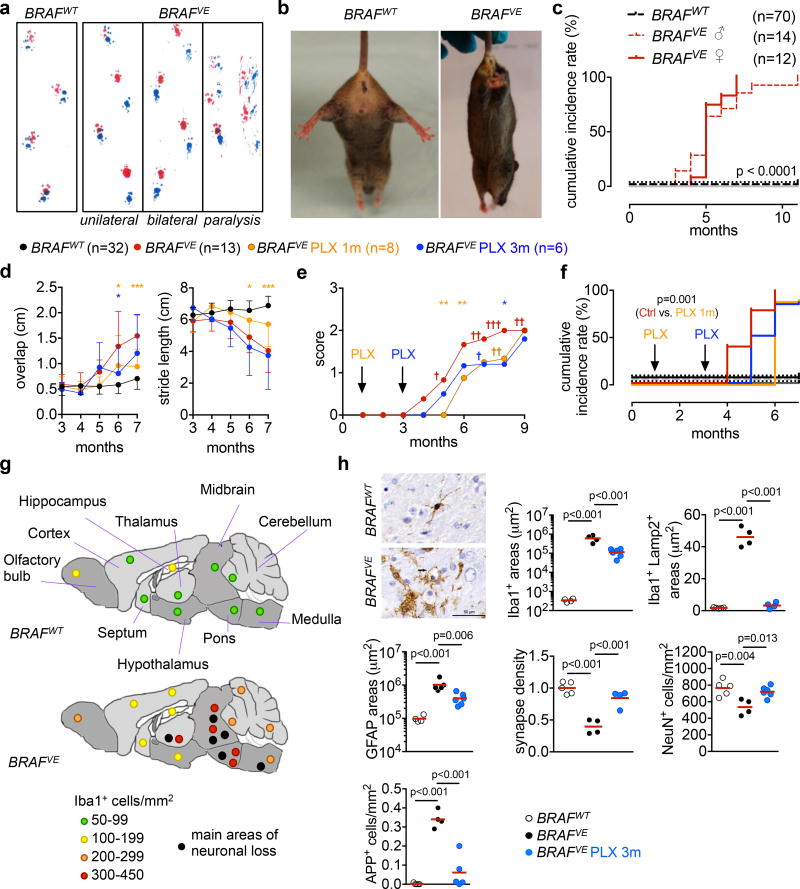
Figure 2. Neurodegenerative disease in BRAFVE mice.
(a) Footprint assays. n=20 mice per group. (b) Limb-clasping reflexes in 6–8-month old mice. n=10 per group. (c) Cumulative incidence of behavioral abnormalities in BRAFVE mice and controls. Log-rank (Mantel-Cox) test. (d) Overlap distance, and stride length of mice on control or PLX4270 diet from 1 month or 3 months of age. Average values ±s.d. for each group, 2way ANOVA, *p<0.05, **p<0.01, ***p<0.001. (e) Disease progression in mice from (d), average score excluding mice euthanized due to paralysis (†). (f) Cumulative incidence of behavioral abnormalities in mice from (d). Log-rank (Mantel-Cox) test (g) Scheme depicting microglia (Iba1) and neuronal (NeuN) densities in brain regions from BRAFVE and BRAFWT (n=4 per group). (h) Iba1 staining and quantitative analysis of microglial accumulation (Iba1+), phagocytosis (Iba1+/Lamp2+), astrogliosis (GFAP+), relative synapse density (determined by Synaptophysin and Homer1), neuronal loss (NeuN) and amyloid precursor protein (APP) in brainstem from 5–9 month-old BRAFVE mice on control diet (n=4), BRAFVE mice on PLX diet (n=4–6), and BRAFWT (n=4). One-way ANOVA. See also Extended data Fig. 4, 6.

