
Extended Data Figure 3. Analysis of CD11cCre; BRAFV600E mouse model.
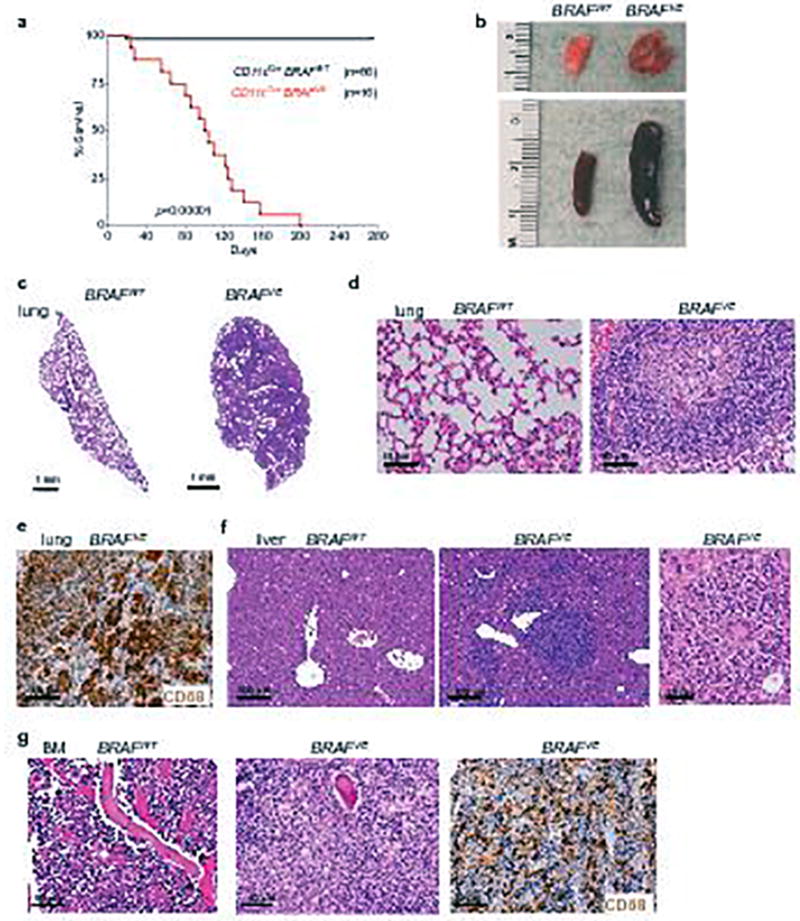
(a) Kaplan-Meier survival curve of BRAFVE (n=16) and BRAFWT (n=66) controls. Log-rank (Mantel-Cox) test. (b) Representative photographs of lung and spleen from BRAFVE mice at time of death with representative BRAFWT control organs. (c–d) Hematoxylin and eosin (HE) stain of lung tissue from BRAFVE and littermate controls. (e) CD68 immunohistochemistry (IHC) of BRAFVE lung tissue. (f) HE stain of liver tissue from BRAFVE and littermate controls with magnified view of granuloma in the BRAFVE liver. (g) HE stain of bone marrow (BM) from BRAFVE and littermate controls with CD68 IHC of BRAFVE mouse. All pictures for (b-g) are representative of n=5 per genotype.