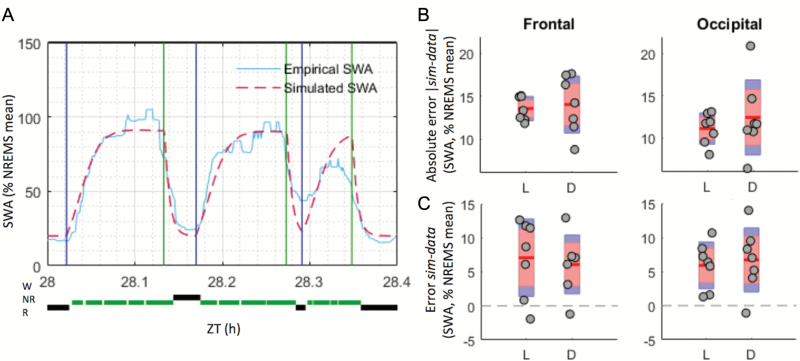
Figure 4.
The SWA simulation fits empirical data similarly well in the light (L) and dark (D) phases. (A) Example of how the difference between mean values of empirical and simulated SWA levels (plotted with one value per 4 s epoch) were taken for each NREMS episode, before being averaged over L or D phases (see Materials and Methods). Beginning and end of NREMS episodes (i.e. where each simulated and empirical SWA means are calculated) are indicated, respectively, with blue and green vertical lines. For each NREMS episode (delimited by a blue and green line), one average SWA value was computed, as required by the optimization process chosen. Here, only 24 min from one animal are shown for clarity. (B) Mean (red line) and individual (grey circles) absolute differences between simulated and empirical SWA levels in the RW group. Values calculated over NREMS episodes lasting longer than 1 min; n = 7. Red area: 95% CI, blue area: 1 SD. Significance was assessed with a two-way ANOVA for repeated-measures, factors “derivation” and “light phase.” No significant main effect or interaction were found (derivation, p = 0.056; light phase, p = 0.529; interaction, p = 0.488). (C) As in (B), but the error (and not absolute error) value of the difference d = SWAsimulation – SWAempirical is kept, allowing to see whether the model over- (positive difference) or under-estimated the empirical data. No significant main effect or interaction was found (derivation, p = 0.873; light phase, p = 0.956; interaction, p = 0.136). NR = NREMS; R = rapid eye movement sleep; sim = simulation; W = wake; ZT= zeitgeber time.

