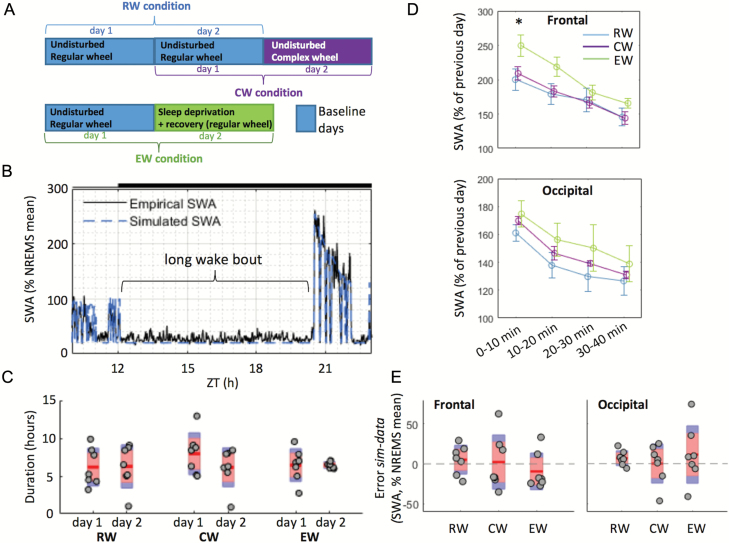
Figure 5.
Impact of waking behaviour on SWA levels and on the accuracy of the model’s predictions following long wake bouts (Supplementary Material). (A) Definition of the 48 hr recordings used for each group: RW, CW, and EW. Blue rectangles: days used for optimization of the parameters; purple and green rectangles: days for which predictions were made. (B) Representation of a typical long wake bout in one animal from the RW group (plotted with one value per 4 s epoch). (C) Average “long wake bout” durations across three conditions (RW, CW, EW) in the first and second days. In each condition, n = 7; red area: 95% CI, blue area: 1 SD; grey circles represent individual animals. A mixed-design ANOVA (factors “condition” and “day”) revealed no significant main effects or interaction. (D) Time course of EEG SWA in NREMS during the 40 min following long wake bouts (10 min intervals) in three conditions. Mean ± SEM, n = 7 in each condition. SWA levels were normalized against mean SWA levels in NREMS during the previous 24 hr of baseline. An ANOVA followed by independent t-tests revealed a significantly higher value in the EW group in the frontal derivation in the first 10 min only (t(12) = −2.272, p = 0.042). (E) Average error between empirical data and simulations in three conditions in 40 min following long wake bouts (day 2). Only NREMS epochs were considered. For each condition, n = 7; red area: 95% CI, blue area: 1 SD; grey circles represent individual animals. The significance of the results was assessed using a mixed design two-way ANOVA (factors “derivation” and “condition”). There was no significant main effect of group or derivation, and no significant interaction group*derivation. sim = simulation; ZT = zeitgeber time.

