Figure 2.
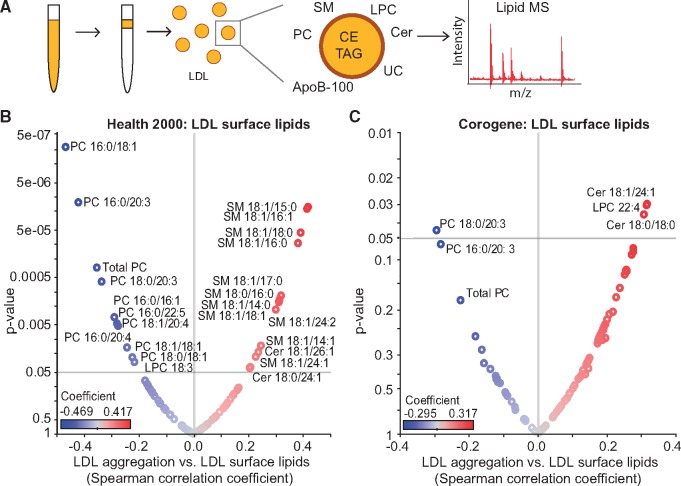
The susceptibility of low-density lipoprotein (LDL) to aggregate strongly correlates with the surface lipid composition of the particles. (A) LDL was isolated from plasma and LDL lipidome was analysed using mass spectrometry. Volcano plots showing Spearman correlation coefficients of LDL aggregate size at 2 h vs. LDL surface lipids in (B) Health 2000 samples and (C) in Corogene samples. Red circles indicate positive correlations, and blue circles indicate negative correlations. The identities of only those lipids with significance correlation values (P < 0.05) are indicated. Cer, ceramide; LPC, lysophosphatidylcholine; PC, phosphatidylcholine; SM, sphingomyelin.

