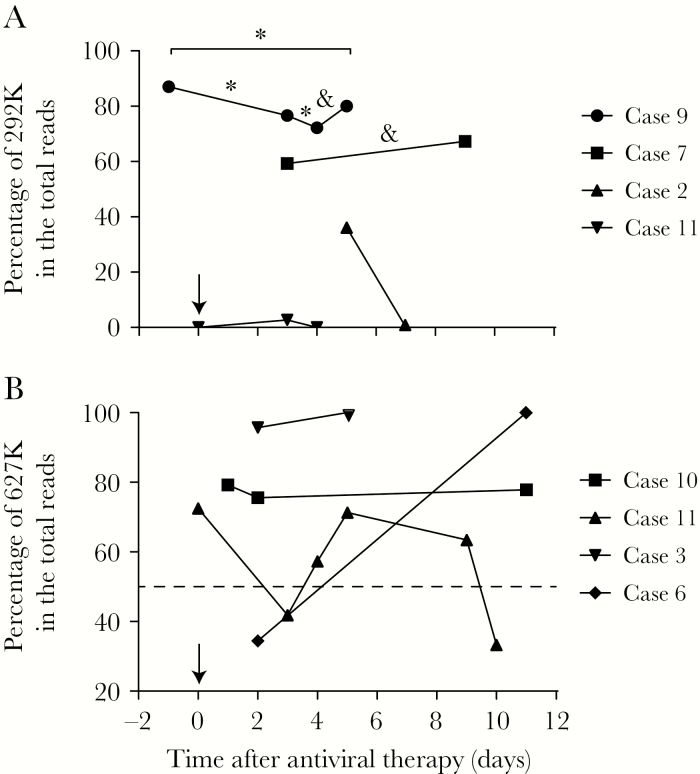
Figure 2.
The kinetics of R292K and E627K mutations in sequential samples obtained from patients during disease development. A, The percentage of 292K reads exhibiting variation in 4 patients at multiple timepoints. A χ2 test was applied to cases 7 and 9 (underlined). *Significant (P < .05 with 95% confidence interval) differences between 2 timepoints. &Insignificant differences between 2 timepoints. B, The percentage of variation in 627K reads in sequential samples collected from 4 cases. The day antiviral therapy was initiated was defined as day “0” and marked with a black arrow. The dashed line indicates the position of 50% on the y-axis.

