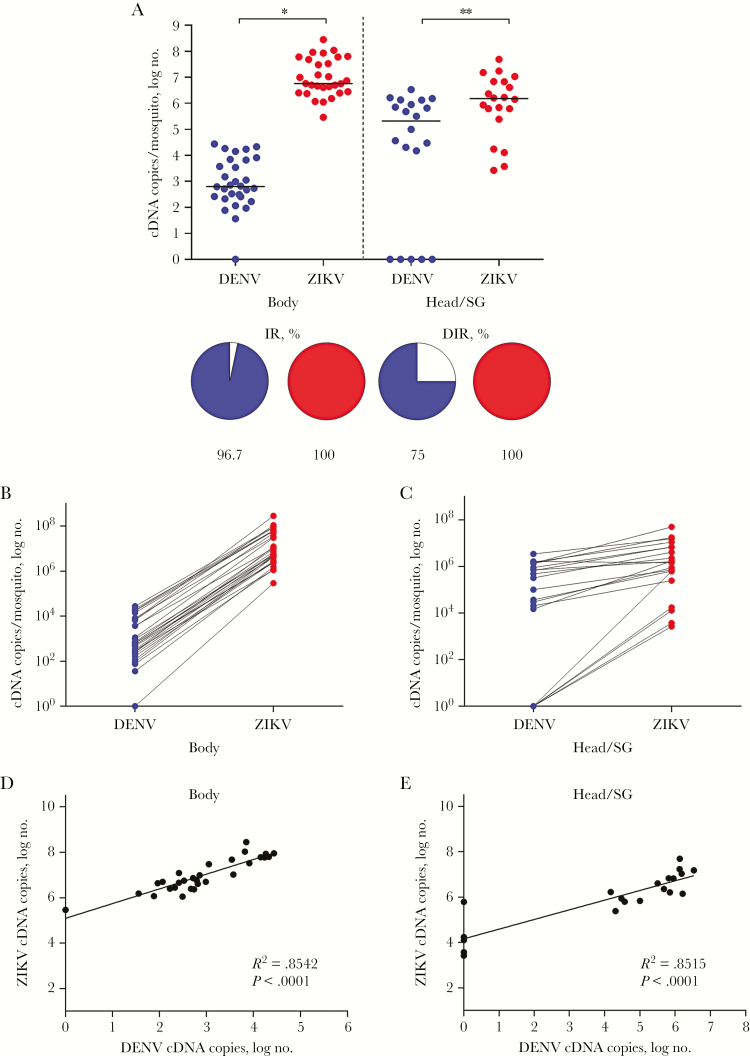
Figure 2.
Comparative analysis of dengue virus (DENV; blue) and Zika virus (ZIKV; red) presence in coinfected Aedes aegypti. A, The intensity of infection of each experimental group is presented as in the graph as the number of complementary DNA (cDNA) copies per mosquito (top). The infection rate (IR) and the disseminated infection rate (DIR) are represented in the pie charts as the percentage of infected mosquito bodies and heads/salivary glands (SGs). The intensity of infection in the coinfected mosquitoes was significantly greater for ZIKV than for DENV in the bodies (P < .001) and heads/SGs (P = .01). The DIR of DENV was significantly lower than that of ZIKV (P = .0475) in these same mosquitoes. B and C, Relationship between the number of cDNA copies, representing the intensity of infection of DENV and ZIKV, in the body and head/SG of each coinfected A. aegypti, with the intensity of ZIKV infection greater in every instance. D and E, Significantly positive correlation between the intensity of infection of DENV and ZIKV in the bodies and heads/SGs of coinfected A. aegypti.

