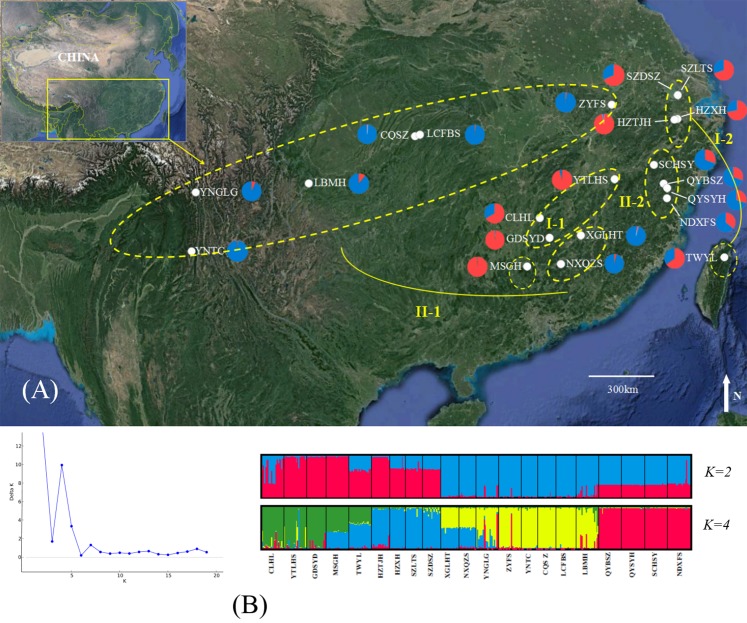
Figure 1. Genetic structure of B. schreberi populations in China.
(A) Sampling area and genetic structure of B. schreberi populations based on K = 2 genetic clusters (I and II); (B) proportional membership of 21 B. schreberi populations to K = 2 and 4 (subcluster I-1, I-2, II-1, II-2) genetic clusters. Individuals are represented by a single vertical column divided into two or four (=K) colors. The relative length of the colored segment corresponds to the individual’s estimated proportion of membership in that cluster. Map data © 2016 Google.

