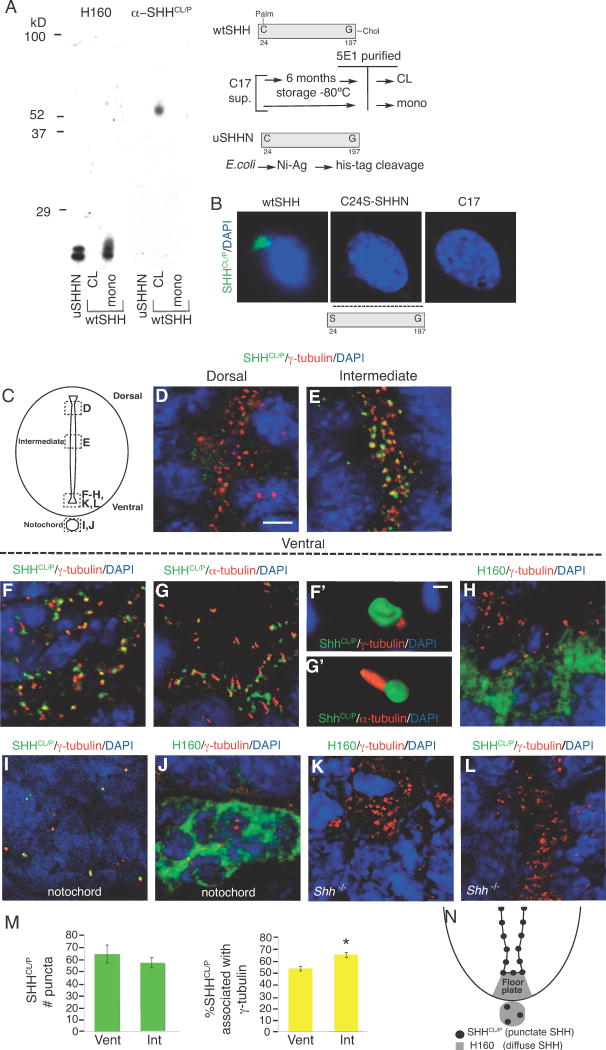
Figure 1. Conformation-specific antibody (α-SHHCl/P) recognizes cross-linked wtSHH in vitro and punctate, cilia BB-associated SHH in embryonic spinal cord ventricles.
A. uSHHN (lipid lacking N terminal fragment), cross-linked wtSHH (wtSHHCL, N-and C-Lipid containing), and soluble monomeric wtSHH (wtSHH monomer, N-and C-lipid containing) are separated by SDS-PAGE and probed by Western blot analysis using α-SHHCl/P and H160 (α-SHH, Santa Cruz). α-SHHCl/P recognizes wtSHHCL, but not soluble monomeric wtSHH or monomeric uSHHN. H160 recognizes monomeric uSHHN and monomeric wtSHH, but not cross-linked wtSHHCL. Schematics for generating wtSHHCL,mono (N-terminal palmitate (Palm) and C-terminal cholesterol (Chol) containing) and uSHHN (lipid lacking) are shown on the right. B. Immunocytochemistry using α-SHHCl/P (green) and DAPI stain for nuclei (blue) detects SHH in C17 cell lines stably transfected with wtSHH, but not C24S-SHHN (N-and C-lipid lacking), and non-transfected control cells (C17). α-SHHCl/P detects wtSHH, but does not detect C24S-SHHN, as it is not expected to remain associated with the membrane. No staining is detected in non-transfected control cells, C17. C. Schematic of coronal section through the E9.5 spinal cord and notochord, with dashed boxes highlighting the regions shown in each subsequent image. D–L. Confocal analysis of immunofluorescent staining in E9.5 spinal cord using α-SHHCl/P (green; D-G′, I, L) or H160 (green; H, J, K) with γ-tubulin (cilia BBs, red; D–F, F′, H–L) or α-acetylated α-tubulin (axonemes, α-tubulin, red; G, G′). Notochord staining using γ-tubulin and α-SHHCl/P (I) or H160 (J). Shh−/− spinal cord staining using H160 (K) and α–SHHCl/P (L). DAPI (nuclei, blue). (F′–G′) Threedimensional reconstructions of ten confocal images taken sequentially along the z-axis from images F and G, respectively (AMIRA software). M. Quantification of the numbers of SHHCL/P puncta (green bars) or SHHCL/P/γ-tubulin double labeled puncta (yellow bars) comparing 2000μm2 regions in INT or VENT regions. *p<0.05, Student’s t-test. N. Schematic of the ventral spinal cord depicting the location of SHHCL/P detected by α-SHHCl/P (cilia BB-associated, black puncta) and H160 (non-BB associated, soluble, diffuse SHH, gray area). Scale bars = 5 μm (D–G, H–L) and 0.5 μm (F′-G′).

