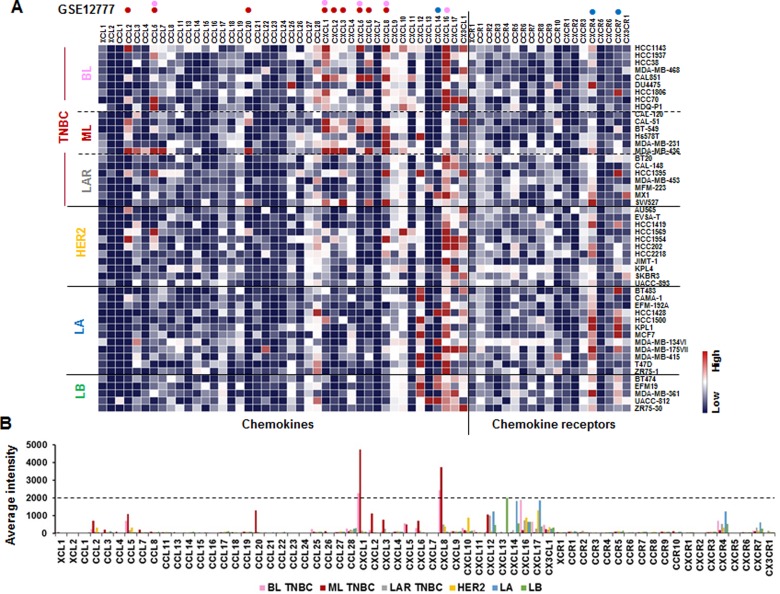
Figure 1. Chemokine signatures in BC cell lines.
(A) Heatmap for RNA expression levels of chemokines and chemokine receptors based on analysis of GEO dataset (Accession: GSE12777) with 51 human BC cell lines using Gitools 2.3.1. Pink and red dots indicate high expression levels in basal-like (BL)- and mesenchymal-like (ML)-TNBC cells, respectively. Blue dots indicate high expression levels in luminal A (LA) subtype. LAR: luminal androgen receptor, LB: luminal B. (B) Average intensity for the expression levels of dominant chemokines and chemokine receptors in different BC subtypes. Pink, red, grey, yellow, blue, and green bars indicate BL-TNBC, ML-TNBC, LAR-TNBC, HER2, LA and LB subtypes, respectively.

