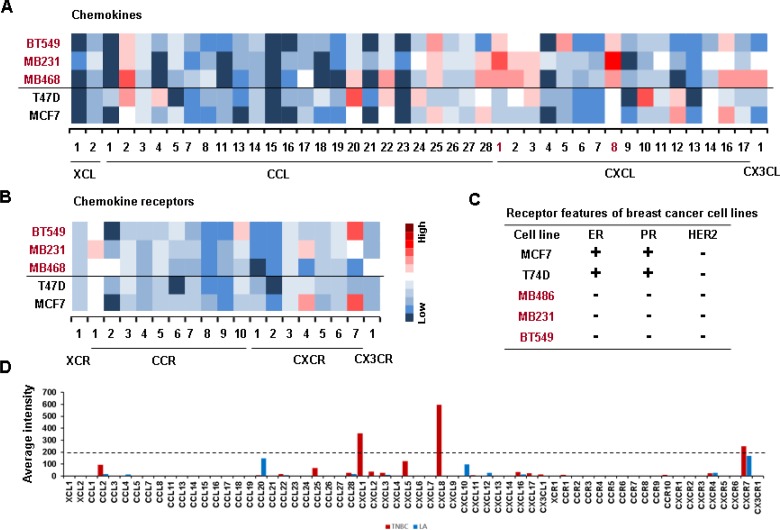
Figure 2. Confirmation of PCR array on elevated proinflammatory chemokines in TNBC cells.
(A) Heatmap for RNA expression levels of chemokines in representative human TNBC (BT549, MB231 and MB468) and non-TNBC (T47D, MCF7) cell lines. (B) Heatmap for RNA expression levels of chemokine receptors in TNBC and non-TNBC cell lines. After isolating total RNA and choosing the qualified RNAs, a human chemokine PCR array was performed. Red trend indicates high expression levels of chemokines. (C) The status of estrogen receptor (ER), progesterone receptor (PR) and HER2 expression in TNBC and LA-BC cells. (D) Average intensity for the expression levels of dominant chemokines and chemokine receptors in TNBC and LA-BC cells. Red and blue bars indicate TNBC and LA-BC cells, respectively.

