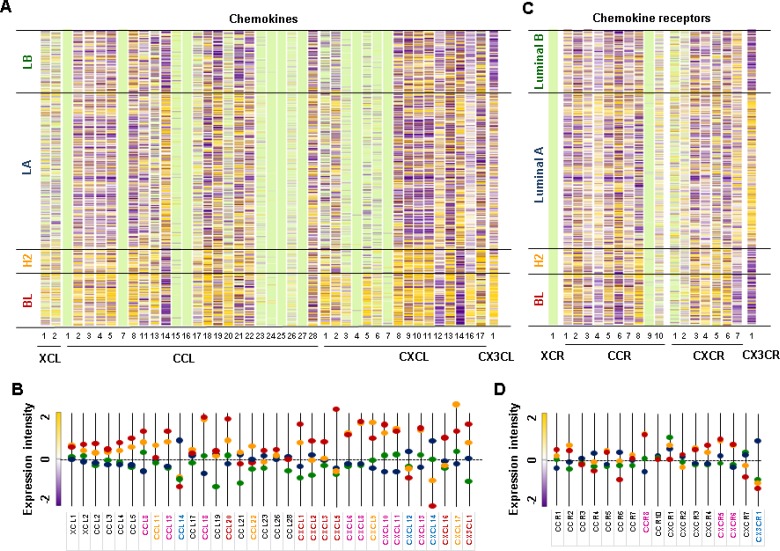
Figure 3. Chemokine signatures in human BC tissues.
(A) Heatmap for chemokine expression profiles in human BC tissues from TCGA-based dataset using Gitools 2.3.1. (B) Statistical analysis of chemokine expression profiles in human BC tissues. (C) Heatmap for chemokine receptor expression profiles in human BC tissues from TCGA-based dataset using Gitools 2.3.1 (D) Statistical analysis of chemokine receptor expression profiles in human BC tissues. BC tissues used include 140 basal-like (BL), 67 HER2 (H2), 419 Luminal A (LA), and 192 Luminal B (LB) samples. The bright green colors in (A) and (C) indicate no determination. The pink letters in (B) and (D) indicate dominant chemokines and chemokine receptors in both BL and HER2 samples. The red, yellow, and blue letters in (B) and (D) indicate dominant chemokines and chemokine receptors in BL, HER2, and LA samples, respectively. Significant increase (p ≤ 0.05) was determined using ANOVA and Tukey's pairwise comparisons.

