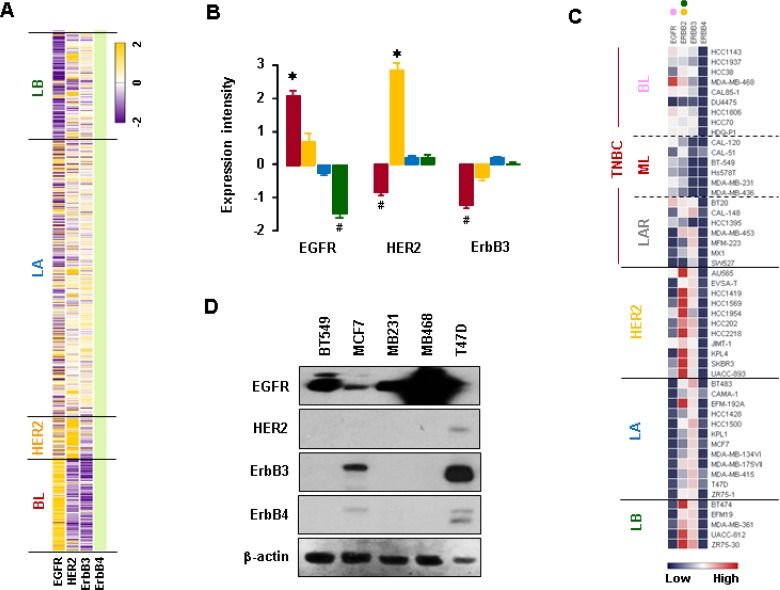
Figure 4. Expression profiles of EGFR family members in BC cells.
(A) Heatmap for RNA expression levels of EGFR family members in human BC tissues from TCGA-based dataset using Gitools 2.3.1. (B) Statistical analysis for RNA expression levels of EGFR family members in human BC tissues. The red, yellow, blue and green colors indicate BL, HER2, LA and LB samples, respectively. The asterisk (*) and hash (#) indicate a statistically significant increase and decrease (p ≤ 0.05) as calculated by ANOVA and Tukey's pairwise comparisons, respectively. (C) Heatmap for RNA expression levels of EGFR family members based on analysis of the GEO dataset (Accession: GSE12777) for 51 human BC cell lines using Gitools 2.3.1. Pink, yellow and green dots indicate high expression levels in BL-TNBC, HER2-BC and LB-BC cells, respectively. (D) Protein levels of EGFR family members in representative TNBC (MB468, MB231, and BT549) and non-TNBC (MCF7 and T47D) cells. β-actin was used as the loading control.

