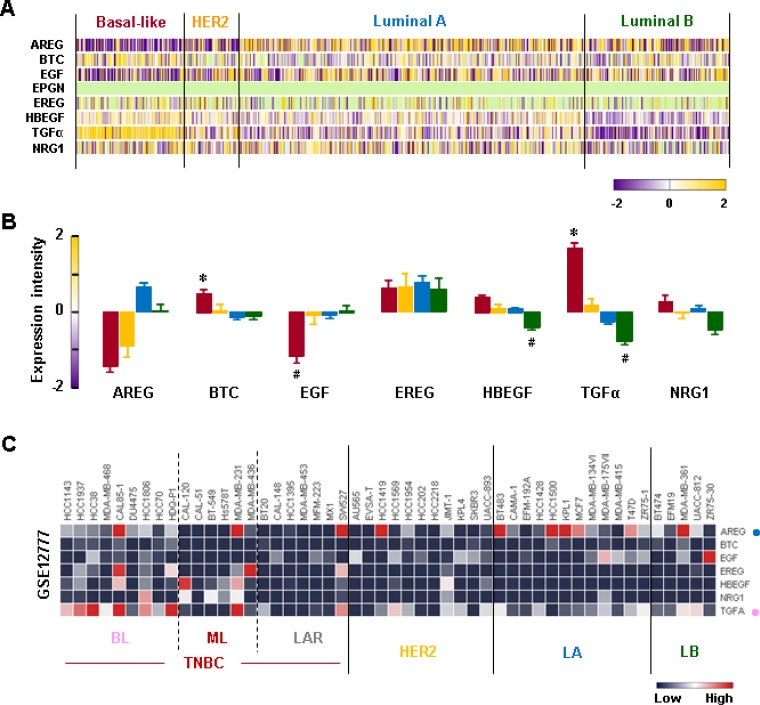
Figure 8. Expression profiles of EGFR-related ligands in BC tissues and cells.
(A) Heatmap for RNA expression levels of EGFR-related ligands in human BC tissues from TCGA-based dataset using Gitools 2.3.1. AREG: Amphiregulin, BTC: Betacellulin, EGF: epidermal growth factor, EREG: Epiregulin, HBEGF: Heparin-binding EGF-like growth factor, TGFα: Transforming growth factor alpha, NRG1: Neuregulin 1. (B) Statistical analysis for RNA expression levels of EGFR-related ligands in human BC tissues. The asterisk (*) and hash (#) indicate a statistically significant increase and decrease (p ≤ 0.05) as determined by ANOVA and Tukey's pairwise comparisons, respectively. (C) Heatmap for RNA expression levels of EGFR-related ligands based on analysis of the GEO dataset (Accession: GSE12777) for 51 human BC cell lines using Gitools 2.3.1. Pink and blue dots indicate dominant EGFR-related ligands in BL-TNBC and LA-BC cells, respectively.

