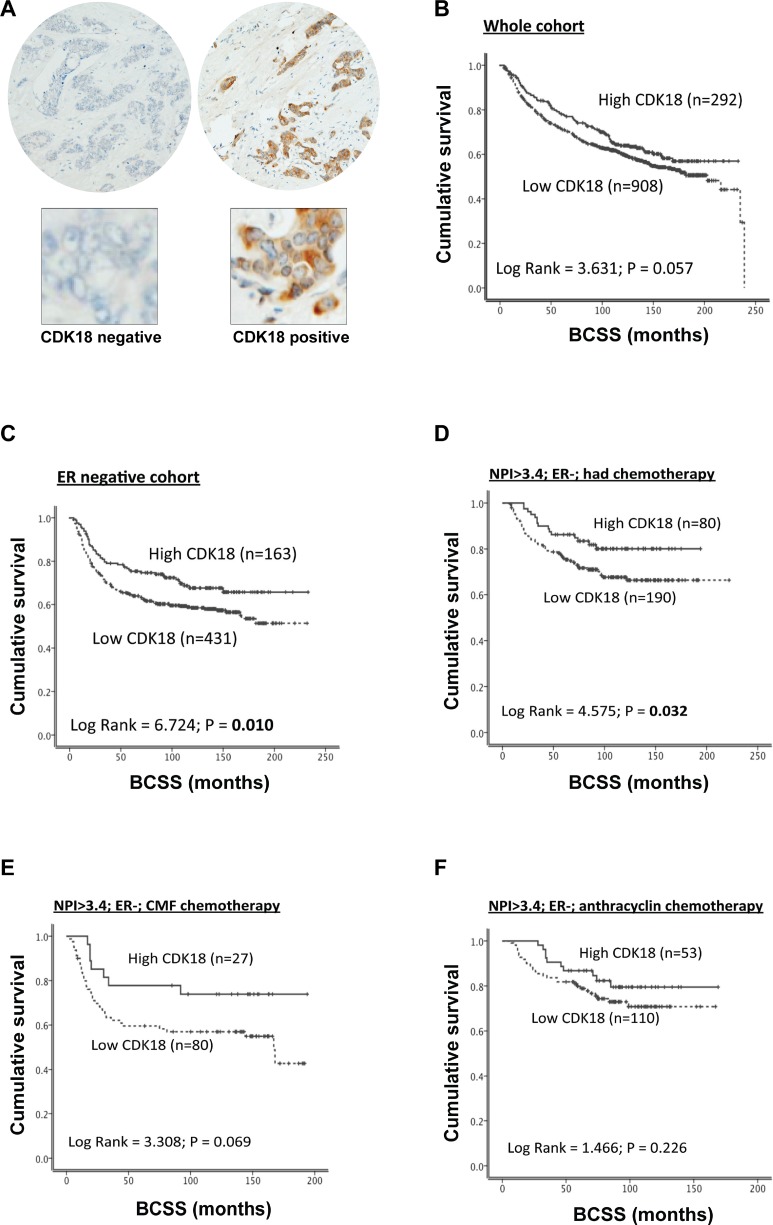
Figure 2. Analysis of CDK18 protein expression in the Nottingham Tenovus breast cancer cohort.
(A) Examples of negative control staining (left panel) and a CDK18 positively stained core breast cancer TMA (right panel), with enlarged images below highlighting the high prevalence of cytoplasmic CDK18 expression. (B) Kaplan–Meier survival curves for CDK18 protein expression (above or below median) plotted against breast cancer specific survival in the whole Nottingham Tenovus breast cancer cohort. (C–F) Kaplan–Meier survival curves for CDK18 protein expression (above or below median) plotted against breast cancer specific survival for the ER- tumours within the Nottingham Tenovus breast cancer cohort stratified using the indicated clinicopathological parameters. CMF; tumours treated with the combination cyclophosphamide, methotrexate and 5-FU clinical chemotherapeutic regime.

