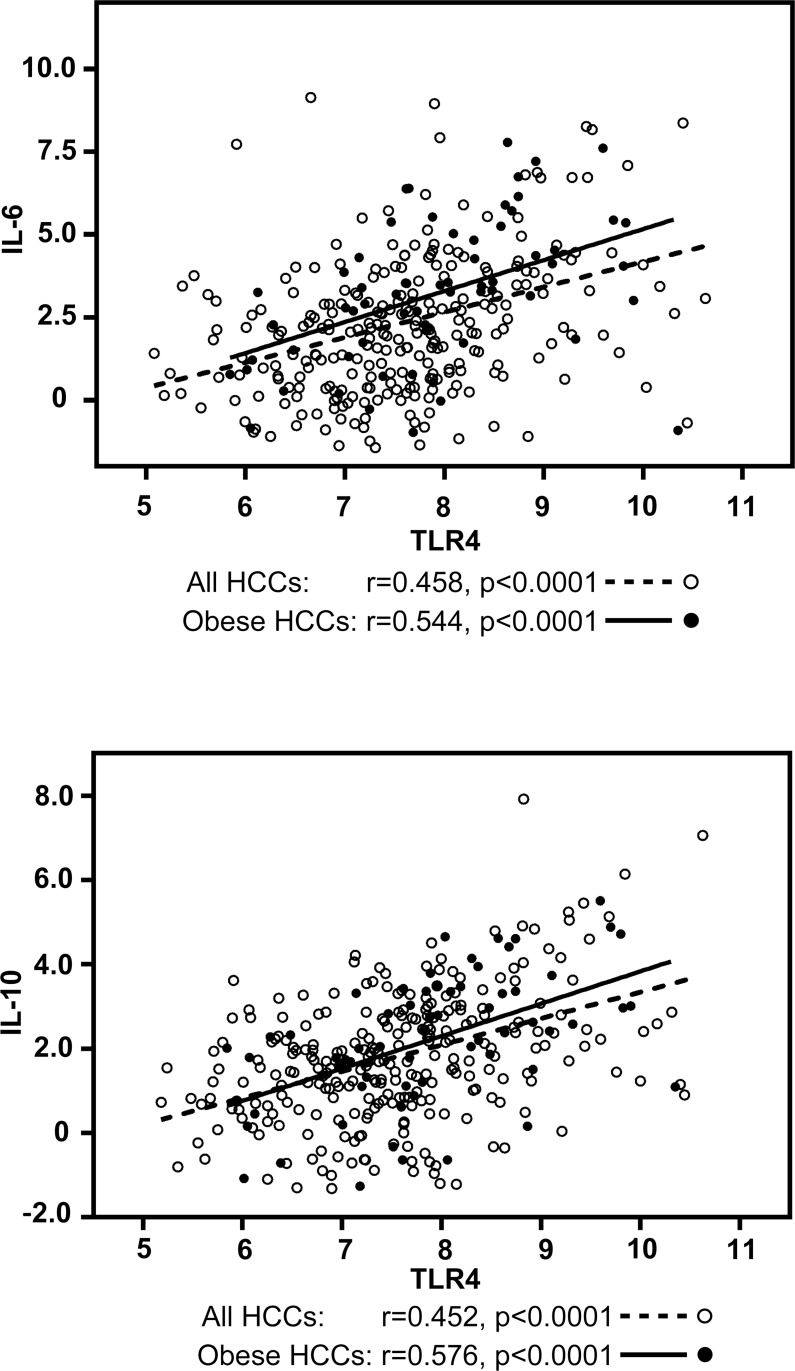
Figure 4. Correlation analysis between TLR4 and IL-6 / IL-10 mRNA expression in HCC tumors in all HCC patients and in obese HCC patients.
Correlation was evaluated using Spearman rank-order correlation coefficient. Graphs are represented using Log2 values in all HCCs (open dots and dotted lines) and in obese HCCs (dark dots and solid lines).

