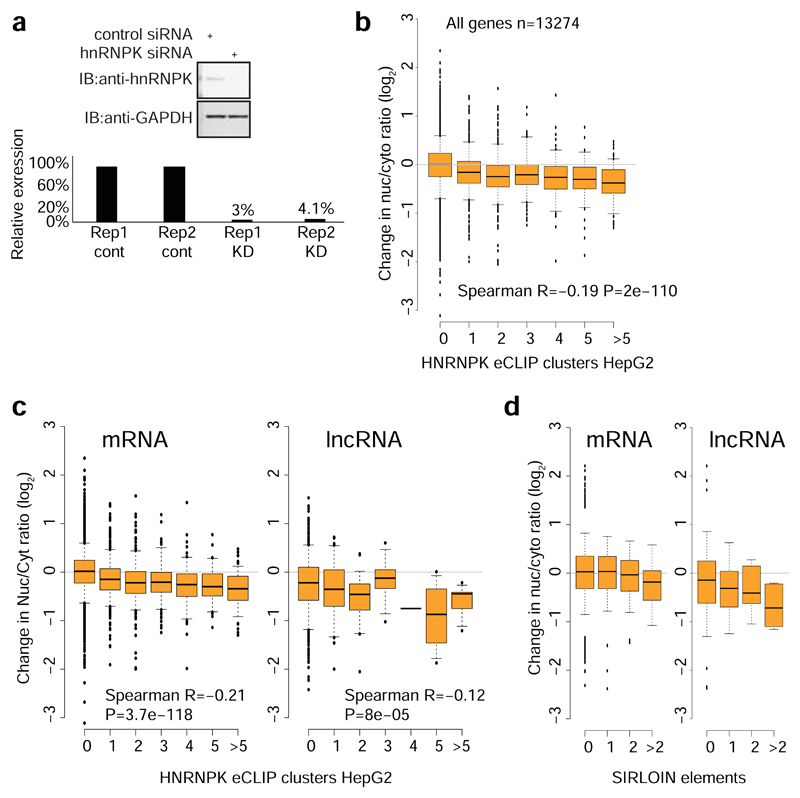
Extended Data Figure 8. HNRNPK knockdown in HeLa cells.
a, Representative Western blot (top) and qRT-PCR quantification of HNRNPK knockdown (each bar is showing the level in a single experiment). Experiment was repeated twice. b, Changes in nuclear/cytoplasmic ratios of genes with the indicated number of HNRNPK eCLIP peaks following HNRNPK knockdown (DESeq2 analysis of two independent replicates). Otherwise as in Figure 4f. n=91–11,016 genes. c, As in b, separately for mRNA and lncRNAs. n=85–10,077 mRNAs per group, 6-939 lncRNAs per group. d, Changes in nuclear/cytoplasmic ratios of mRNAs and lncRNAs with the indicated number of SIRLOIN elements. Otherwise as in Figure 4f. n=53–11,172 mRNAs per group, 10-891 lncRNAs per group.

