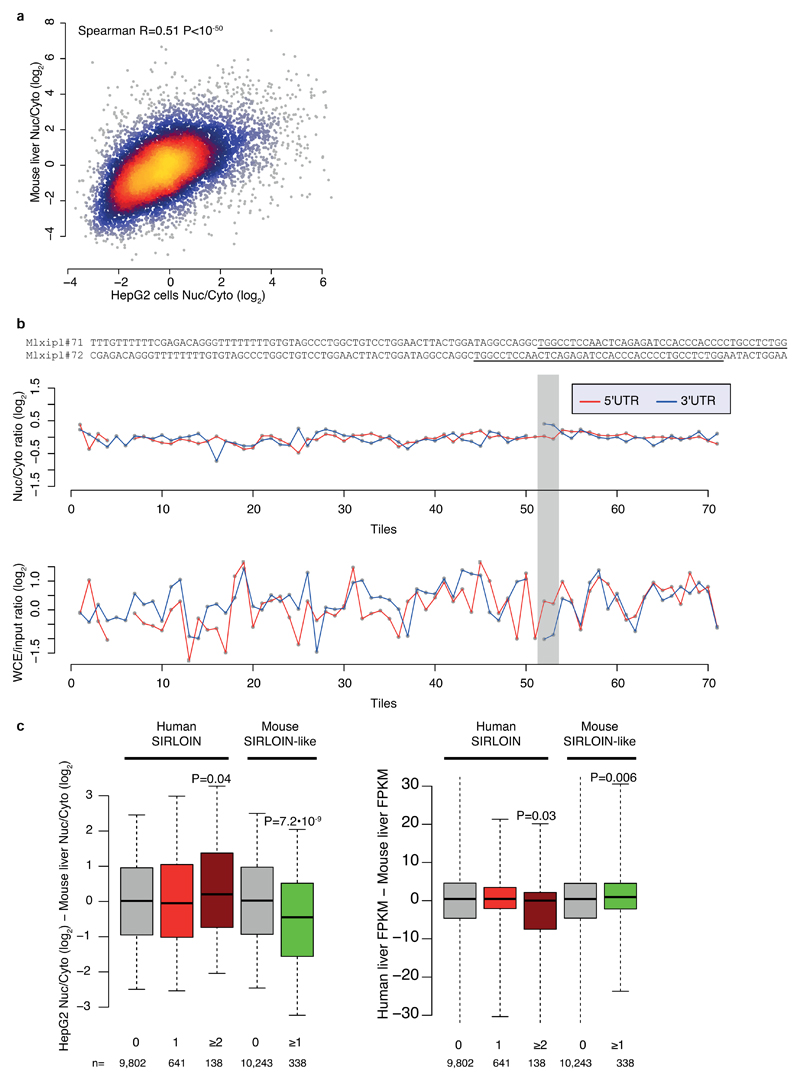
Extended Data Figure 9. SIRLOIN-like element in mouse.
a, Comparison of nuclear/cytoplasmic ratios for orthologous genes in human HepG2 cells (ENCODE data) and mouse liver3. n=10,160 conserved genes. Coloring indicates the local point density. Correlation computed using Spearman correlation. b, Top: sequences of the Mxlipl#71/72 tiles in NucLibA. Center: nuclear/cytoplasmic ratios for each tile with a sufficient number of reads in NucLibA. Bottom: WCE/input expression levels for each tile. The region of tiles #71-72 is shaded in gray. c, Left: Difference in log-transformed nuclear/cytoplasmic ratios between orthologous genes with the indicated number of human SIRLOIN elements or mouse SIRLOIN-like elements. Right: Differences in overall expression levels, human liver expression data taken from the Human Proteome Atlas39, mouse liver expression data taken from the ENCODE project. P-values computed using two-sided Wilcoxon test. Boxplots show 5th, 25th, 50th, 75th and 95th percentiles.

