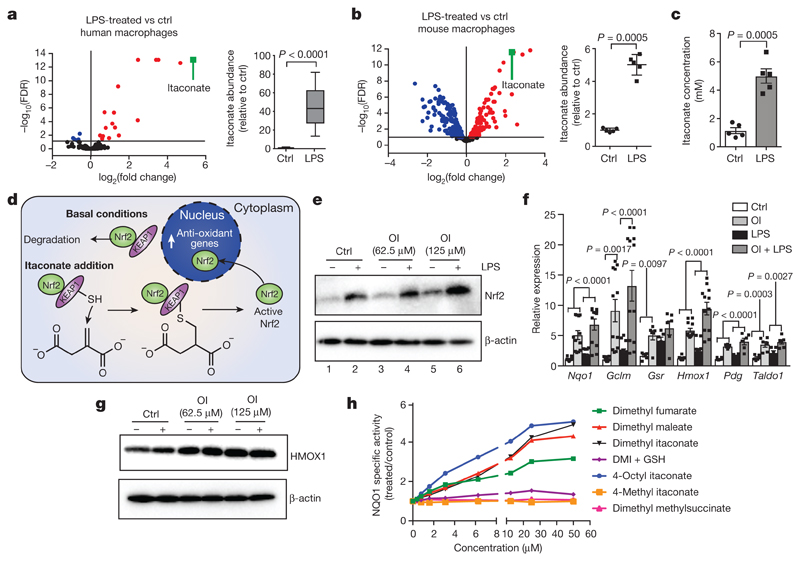
Figure 1. Itaconate activates Nrf2.
a–c, Metabolite levels and itaconate abundance in control (ctrl) versus LPS-induced (a, n = 12, 4 h; b, c, n = 5, 24 h) human (a) and mouse (b, c) macrophages. Red and blue dots represent metabolites significantly up- and downregulated by LPS, respectively. FDR, false discovery rate. d, Reactivity of itaconate with KEAP1 thiol group. e, g, LPS-induced Nrf2 (e, 24 h) and HMOX1 (g, 6 h) after treatment with OI as indicated. f, Nrf2 target gene expression in mouse macrophages with or without LPS (6 h) and OI (Nqo1, Gclm, Hmox1, n = 12; Gsr, Pgd, Taldo1, n = 6). h, NQO1 activity in mouse Hepa1c1c7 cells treated as indicated (48 h, n = 8). Data are mean ± s.e.m. P values calculated using one-way or two-way analysis of variance (ANOVA) for multiple comparisons or two-tailed Student’s t-test for paired comparisons. Blots are representative of three independent experiments. In the box plots, line shows mean. For gel source data, see Supplementary Fig. 1.

