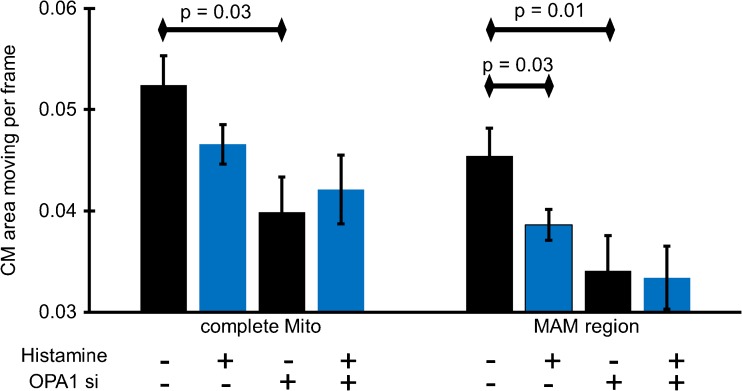
Fig. 4.
Impact of agonist-induced ER Ca2+ release on IMM-dynamics in control cells and cells depleted from OPA1. HeLa cells stained with MTG and transfected with ER-RFP and either control siRNA or OPA1-specific siRNA were imaged with N-SIM. Histamine (100 μM) was added to induce ER Ca2+ release. CM-dynamics of the entire IMM surface and that of MAM-related areas (five iterations) were quantified. Images and analyses were obtained from at least five cells in each of eight experiments. Bars represent mean ± SEM

