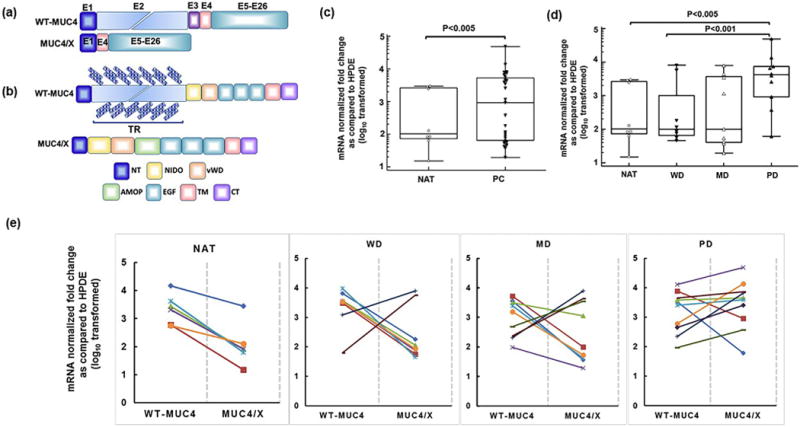
Fig. 1.

Expression of MUC4/X and wild-type (WT)-MUC4 mRNA in pancreatic cancer (PC) clinical samples and normal adjacent pancreatic tissues (NAT). (a) Schematic diagram of WT-MUC4 and MUC4/X mRNA structure. The WT-MUC4 is comprised of 26 exons while splice variant MUC4/X is devoid of exons 2 and 3. Exons are represented by box. (b) Schematic diagram of the domain structure of WT-MUC4 and MUC4/X. WT-MUC4 is a transmembrane mucin characterized by the presence of multiple domains including N-terminal (NT), Tandem Repeat (TR), Nidogen like (NIDO), Adhesion-associated domain in mucin MUC4 and other protein (AMOP), von Willebrand D (vWD), Epidermal Growth Factor (EGF), transmembrane (TM), and cytoplasmic (CT) domain. The unique splice variant, MUC4/X, is characterized by the presence of all domains of WT-MUC4 except the heavily glycosylated and polymorphic TR domain. Diagonally placed blue checker boxes represent O-glycosylation within the TR domain present in WT-MUC4. (c–d) Box and whisker plots are representing MUC4/X mRNA fold change (log10 transformed) in PC tissues and normal tissues adjacent to tumor (NAT) by qPCR and ΔΔCt method. (c) Significantly, elevated expression of MUC4/X was observed in pancreatic tumor tissues in comparison to NAT tissues (p < 0.005). (d) The qPCR analysis of MUC4/X mRNA expression levels in pancreatic NAT, well-differentiated (WD), moderately-differentiated (MD), and poorly-differentiated (PD) cases. Elevated expression of MUC4/X was observed in PD pancreatic tumors in comparison to NAT (p < 0.005) as well as WD tumors (p < 0.001). Two-tailed Student’s t-test was used to determine the statistical difference between two groups. The circle represents individual mRNA expression in NAT tissues whereas triangle represents PC cases. The interquartile range (IQR) for MUC4/X expression is presented by box and whisker plot (horizontal line represents the 25th percentile, median and 75th percentile and whisker represents 5th and 95th percentile). (e) Line diagram is representing mRNA fold change (log10 transformed) of both WT-MUC4-and MUC4/X in PC tissues and normal tissues adjacent to tumor by qPCR and ΔΔCt methods in NAT, WD, MD, and PD groups. Each line represents individual patient data for WT-MUC4 and MUC4/X where the left and right endpoint represent fold change of WT-MUC4 and MUC4/X expression respectively. β-actin was used as an internal control to normalize the expression of respective gene, and normal human pancreatic ductal epithelial (HPDE) cell line mRNA expression levels were used as calibrant control for determining fold change across patient groups. Y-Axis represent value as fold change (log10 relative quantification) relative to HPDE.
