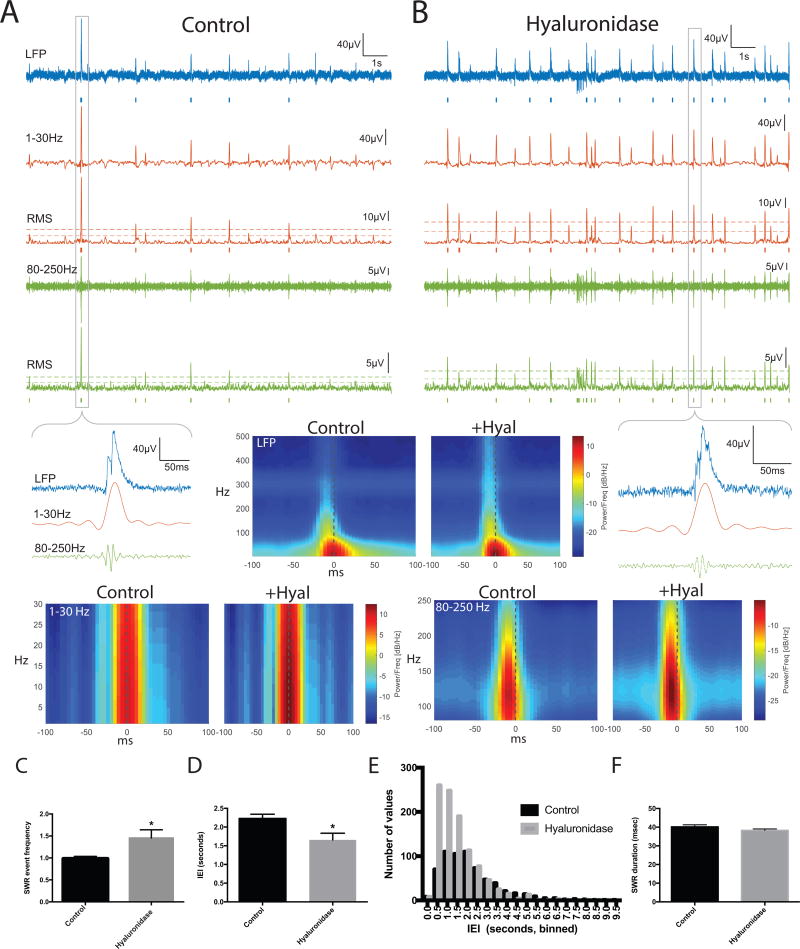
Figure 3.
SWR event frequency in hyaluronidase treated slices. A: 1st trace: Control slice 15s recording of LFP (filtered 0.5–1500Hz). Blue bars indicate detected SWR event, defined as a coincident SW and ripple event. 2nd trace: lower frequency SW component filtered 1–30Hz. 3rd trace: Root mean square of SW filtered from 1–30Hz. Dashed lines indicate 2 and 4 SD above baseline for event detection. Red bars below indicate detected SW event. 4th trace: high frequency ripple component filtered from 80–250Hz. 5th trace: Root mean square of ripple filtered 80–250Hz. Dashed lines indicate 2 and 4 SD above baseline for event detection. Green bars below indicate detected ripple event. B shows the same features for Hyaluronidase treatment. Zoomed in views of indicated SWR events are shown, as are spectrogram averages for the indicated frequency ranges in all detected SWR events from 8 control and 8 hyaluronidase pretreated slices (time-locked to the SW peak; n= 743 control events and 1114 hyaluronidase events). C shows the fold change in average SWR event frequency for two to three paired slices from each of 3 different animals (n=8 slices per group), and overall SWR inter-event interval results from the 8 control and 8 treated slices is shown in D. The difference between control and treatment SWR frequency in 3C and D is significant (p < 0.05). A frequency histogram of inter-event intervals is shown in E. In 3F, we show that in contrast to SWR event frequency, SWR duration is unchanged by hyaluronidase treatment.

