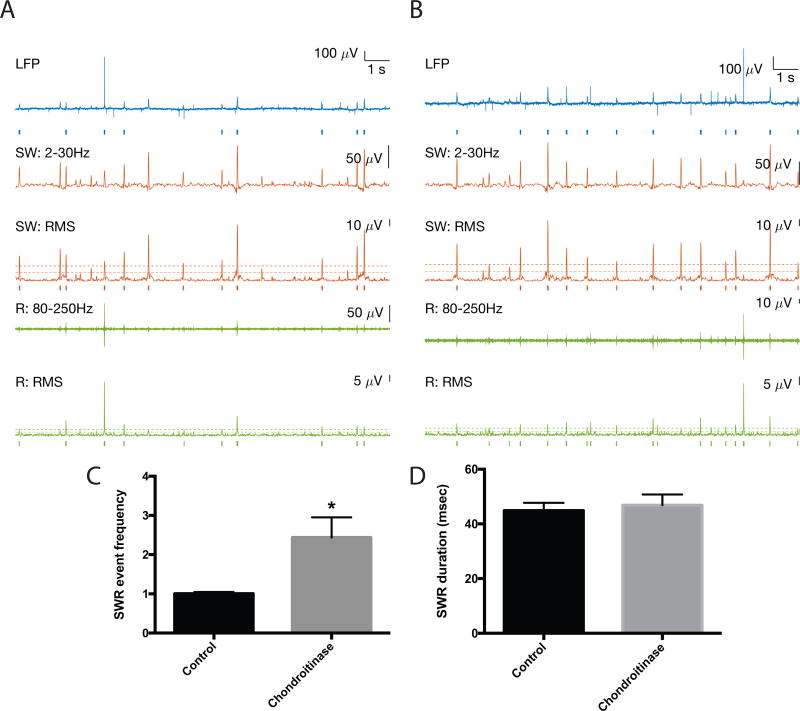
Figure 4.
SWR event frequency in chondroitinase treated slices. Representative traces are shown in 4A and B, with SW events again in red and ripples in green. The fold change in average SWR event frequency results for 4 control and 4 treated slices is shown in 4C. The difference between control and treatment SWR frequency in 4C is significant (p < 0.05). In 4D, we show that in contrast to SWR event frequency, SWR duration is unchanged by chondroitinase treatment.

