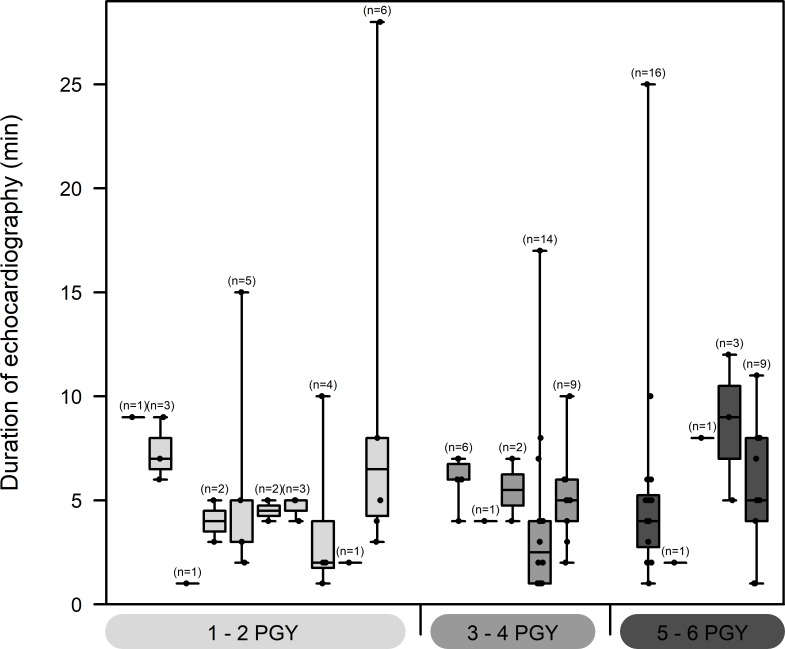
Fig 6. Number and duration of examinations performed at the resident level.
The Boxplot shows the distribution and sample sizes of duration of echocardiography measurements in minutes for all 20 sonographers. On the x-axis, sonographers are grouped according to experience (PGY 1/2, 3/4 and 5/6). The boxes show median values and 25% and 75% quantiles with minimum and maximum as whiskers. Additional black dots represent the original data.

