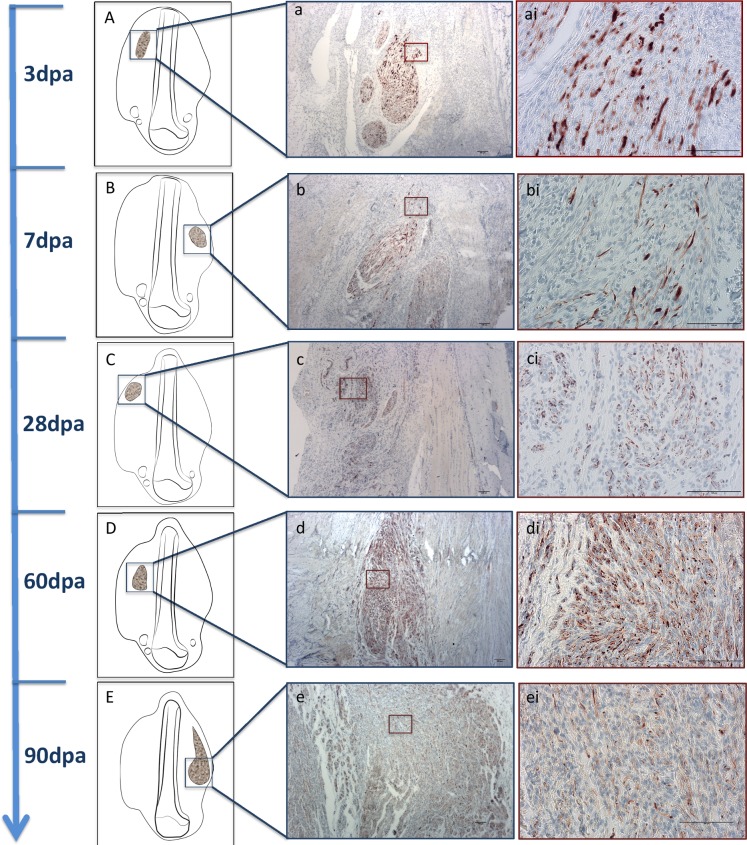
Fig 2. Specific NF staining of nerve regrowth and neuroma development observed in the tissue sections from day 3 until 90.
(A, B, C, D and E) Schematic figures representing an overview of structures location and representative images of axonal fascicles show larger and closer view (a, b, c, d and e with 4x magnification; ai, bi, ci, di and ei with 20x magnification, scale bar = 100μm) of structures throughout time.

