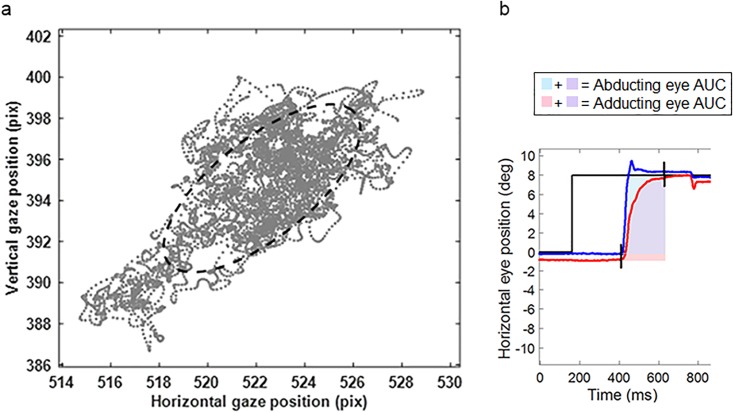
Fig 4. Example of two parameters of the DEMoNS protocol.
a. Scatterplot of left eye gaze positions of one subject (JNB) of the first central fixation trial. The 68% Bivariate Contour Ellipse Area (BCEA) is represented by the dashed line, which is the area of a bivariate ellipse encompassing 68% of the highest density samples. The arrows are indicating the distance of 0.1 degree of visual angle in the horizontal and vertical dimension. b. Schematic representation of the area under the curve (AUC) of the horizontal saccadic trajectory of a rightward saccade. The blue line represents the right eye and the red line represents the left eye. The AUC is assessed from the first starting saccade (left or right eye) until the last ending saccade (left or right eye). In this period the area is calculated for both eyes separately by summing the horizontal eye position at every time point minus the horizontal start position of the saccade.

